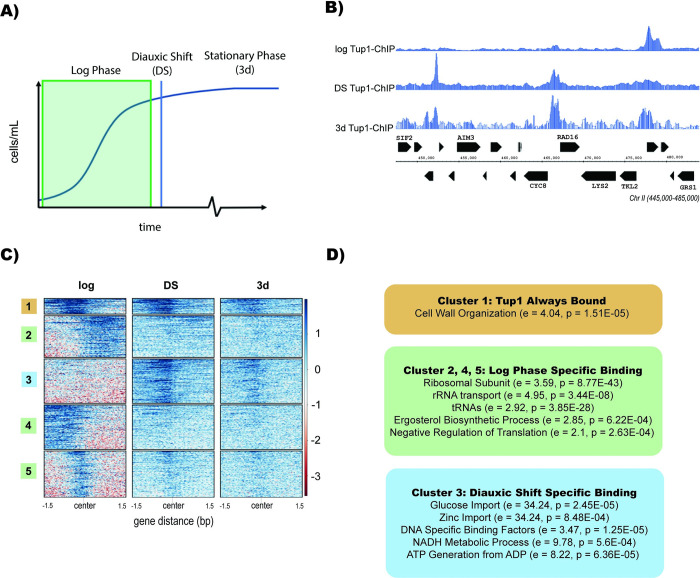
Fig 1. Tup1 Relocalizes After Glucose Starvation.
(A) Illustration of a yeast growth curve indicating diauxic shift (DS) and stationary phase (3d). (B) Integrated Genome Browser (IGB) tracks representative of Tup1-myc ChIP-Seq during log phase, diauxic shift, and stationary phase. Data are normalized to RPKM. (C) ChIP-Seq heatmap of Tup1 binding during log phase, diauxic shift, and stationary phase. Heatmap was clustered using deeptools and sorted by binding intensity. (D) Gene ontology analysis from GOrilla of Tup1 binding locations with relative enrichment (e) and p-value (p) indicated for each term.

