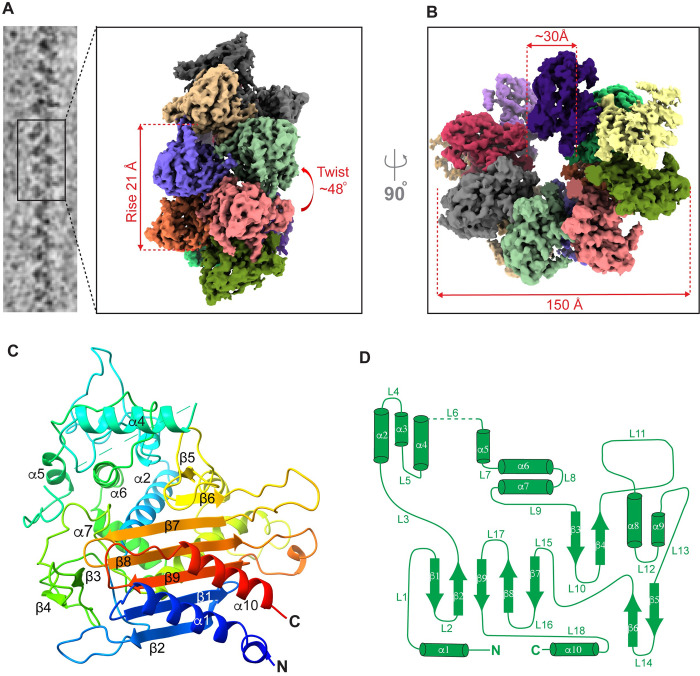
Fig 2. CryoEM structure of human LACTB filament.
(A) CryoEM images of helical LACTB filaments were processed to obtain the 3D reconstruction of the polymer. LACTB protomers are colored differently, and filament rise and twist are indicated. (B) Top view of the LACTB assembly with the indicated filament width and inner lumen diameter. (C) Ribbon diagram of LACTB monomer. The chain is colored in a rainbow gradient from N-terminus (blue) to C-terminus (red). Secondary structure elements of one protomer are labeled. (D) LACTB (residues 97 to 547) α-helices (cylinders), β-sheets (arrows), and loops (lines) are depicted in a topology diagram.

