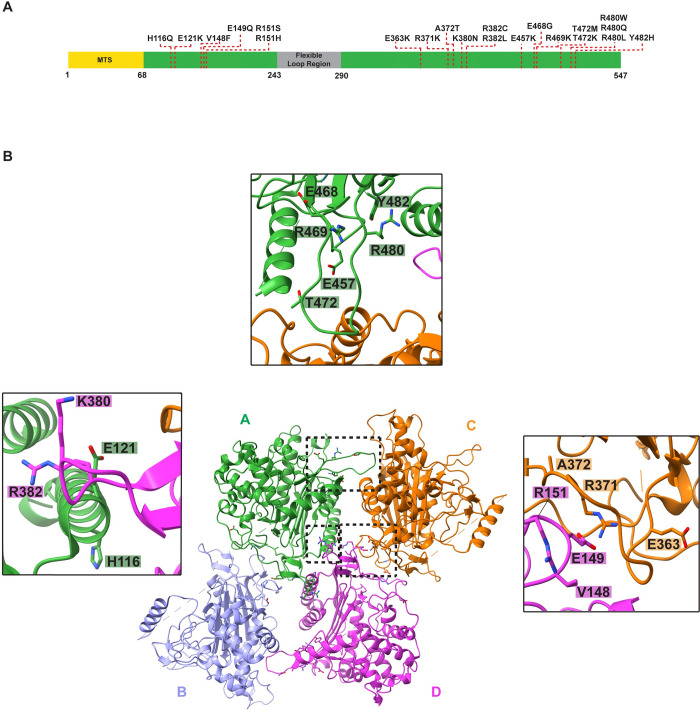
Fig 6. The model of LACTB enables mapping the disease-associated mutations.
(A) A schematic representation of full-length LACTB architecture. Residues 1–68 contain the predicted MTS and residues 243–290 form the flexible loop region. Residues that are associated with various human cancers are highlighted with a red dashed line. (B) Ribbon diagram of human LACTB tetramer. Protomers that form the tetramer are labeled A to D and colored as in Fig 4A. Mutations localizing to oligomerization interfaces are illustrated as sticks. Inset windows show the close-up views of oligomerization interfaces containing disease-associated mutations. Black boxes indicate the dimer and polymerization interfaces 1 and 2, respectively. MTS, mitochondrial targeting sequence.

