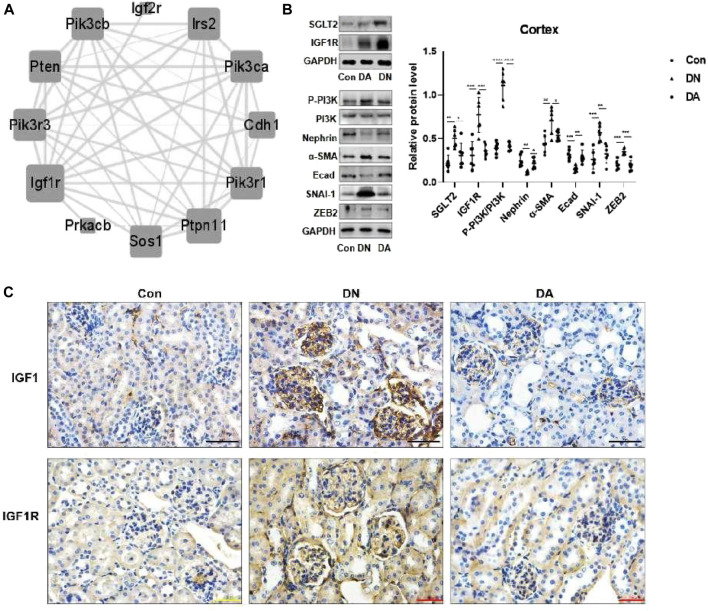
FIGURE 3.
In DN models, upregulation of SGLT2 activated IGF1R/PI3K signaling. (A) IGF1R-centered PPI network (combined score>0.9). (B) Protein expression levels of SGLT2, IGF1R, phosphorylated PI3K, and EMT markers were analyzed using Western blotting. The data were analyzed by ANOVA with Tukey’s post hoc test. (C) IHC images of IGF1 and IGF1R. PPI: protein–protein interaction; *p < 0.05, **p < 0.01.

