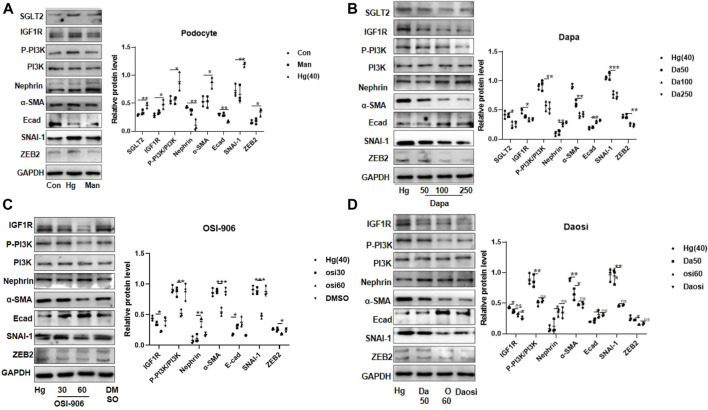
FIGURE 4.
SGLT2 directly regulated podocyte EMT via IGF1R/PI3K signaling. (A) Representative WB images and densitometric analysis of the expression of SGLT2, IGF1R, phosphorylated PI3K, and EMT markers in high-glucose-stimulated podocytes (Hg: 40 nM, 24 h). (B) Podocytes treated with different doses of dapagliflozin (50 nM, 100 nM, and 250 nM) and (C) OSI-906 (30 nM and 60 nM). (D) Combination of OSI60 and Da50. EMT: epithelial–mesenchymal transition. The data were analyzed by ANOVA with Tukey’s post hoc test. N = 3; *p < 0.05, **p < 0.01, ***p < 0.001, ****p < 0.001.

