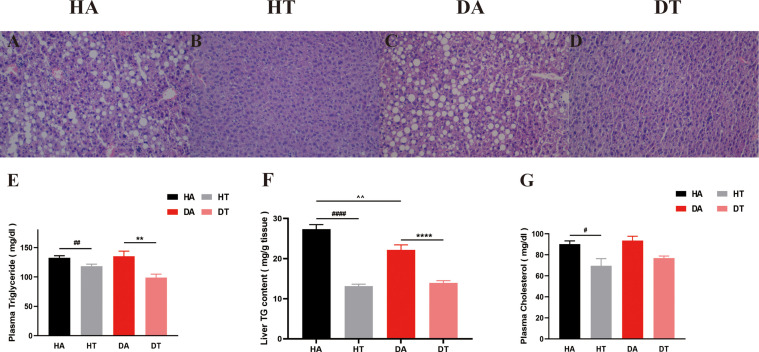
Figure 6.
Representative liver morphology, triglyceride content in liver, and plasma lipid profiles in different groups. (A-D) H&E staining of liver sections (microscope whose magnification: ×20). (E) Triglyceride levels in plasma. (F) Triglyceride content in the liver. (G) Plasma cholesterol levels. All data were presented as mean ± SEM. **P < 0.01, ****P < 0.0001, DA group vs. DT group; #P < 0.05, ##P < 0.01, ####P < 0.0001, HA group vs. HT group. ^^P < 0.01, DA group vs. HA group.

