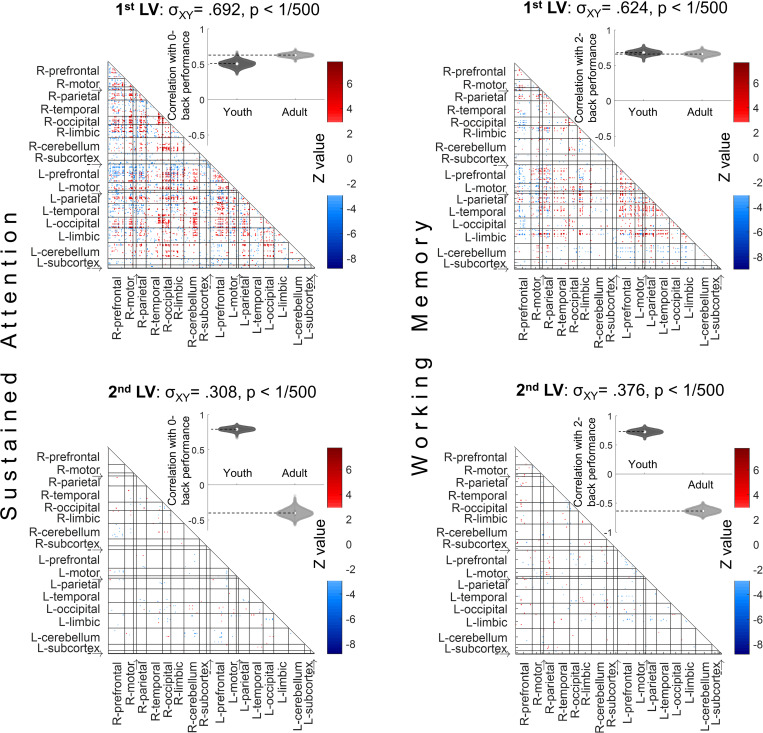
Fig 7.
The data-driven LVs for the sustained attention (left column) and working memory (right column) PLS regressions. Left column: PLS relating functional connectivity to SA performance and age group successfully identified functional connectivity patterns related to better attentional performance in both ABCD youth and HCP adults (first LV), as well as connections differentially related to performance in youth and adults (second LV). Right column: PLS relating functional connectivity to WM performance and age group successfully identifies functional connectivity patterns related to better WM performance in both youth and adults (first LV), as well as connections differentially related to performance in youth and adults (second LV). P values are calculated from 500 permutations and LV weights are calculated from 500 bootstraps in each PLS; significant connections are those that have bootstrap ratios (Z) above +3 or below −3. We randomly selected 754 of the ABCD sample in each PLS to make the age group sizes balanced (HCP has n = 754) and the presented figure is averaged over 200 bootstrapped balanced samples. Using the full 1,545 ABCD participants instead of randomly balanced group sizes results in very similar PLS LVs. Anatomical labels: R and L refer to right and left hemispheres; “→” is insula and “-→” is brainstem. The data for this figure are available at NDA study 1849 10.15154/1528288. ABCD, Adolescent Brain Cognitive Development; HCP, Human Connectome Project; LV, latent variable; PLS, partial least squares; SA, sustained attention; WM, working memory.

