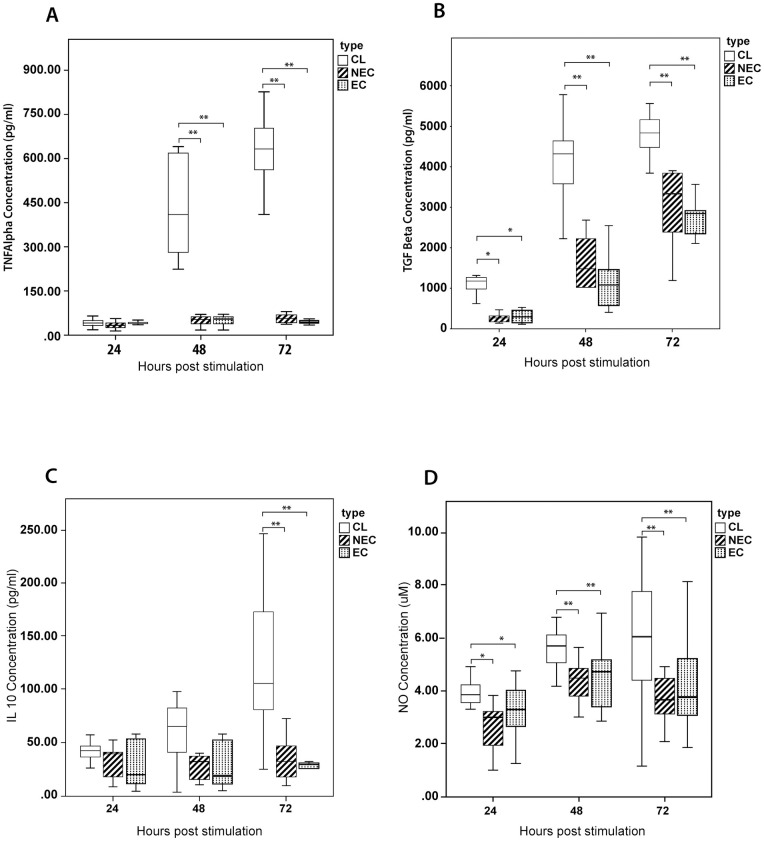
Fig 2. Comparison of selected inflammatory markers secreted by PBMC derived macrophages stimulated with SLA.
Monocyte derived-macrophages from patients with LCL (n = 20), healthy non endemic controls (n = 10) and healthy endemic controls (n = 20) were stimulated with L. donovani antigen (50μg/ml). The supernatant was harvested at 24, 48 & 72 hours and (A) TNF-α (B) TGF-β (C) IL-10 and (D) NO levels were determined by ELISA and Griess test respectively (in duplicate). The box represents the IQR (i.e. the middle 50% of the observations) with the horizontal line representing the median. The whiskers represent the main body of the data, indicating the range of the data. For statistical analysis, nonparametric Kruskal-Wallis test followed by Dunn’s multiple comparison test was used (*p<0.05; **p<0.01; ***p<0.001).

