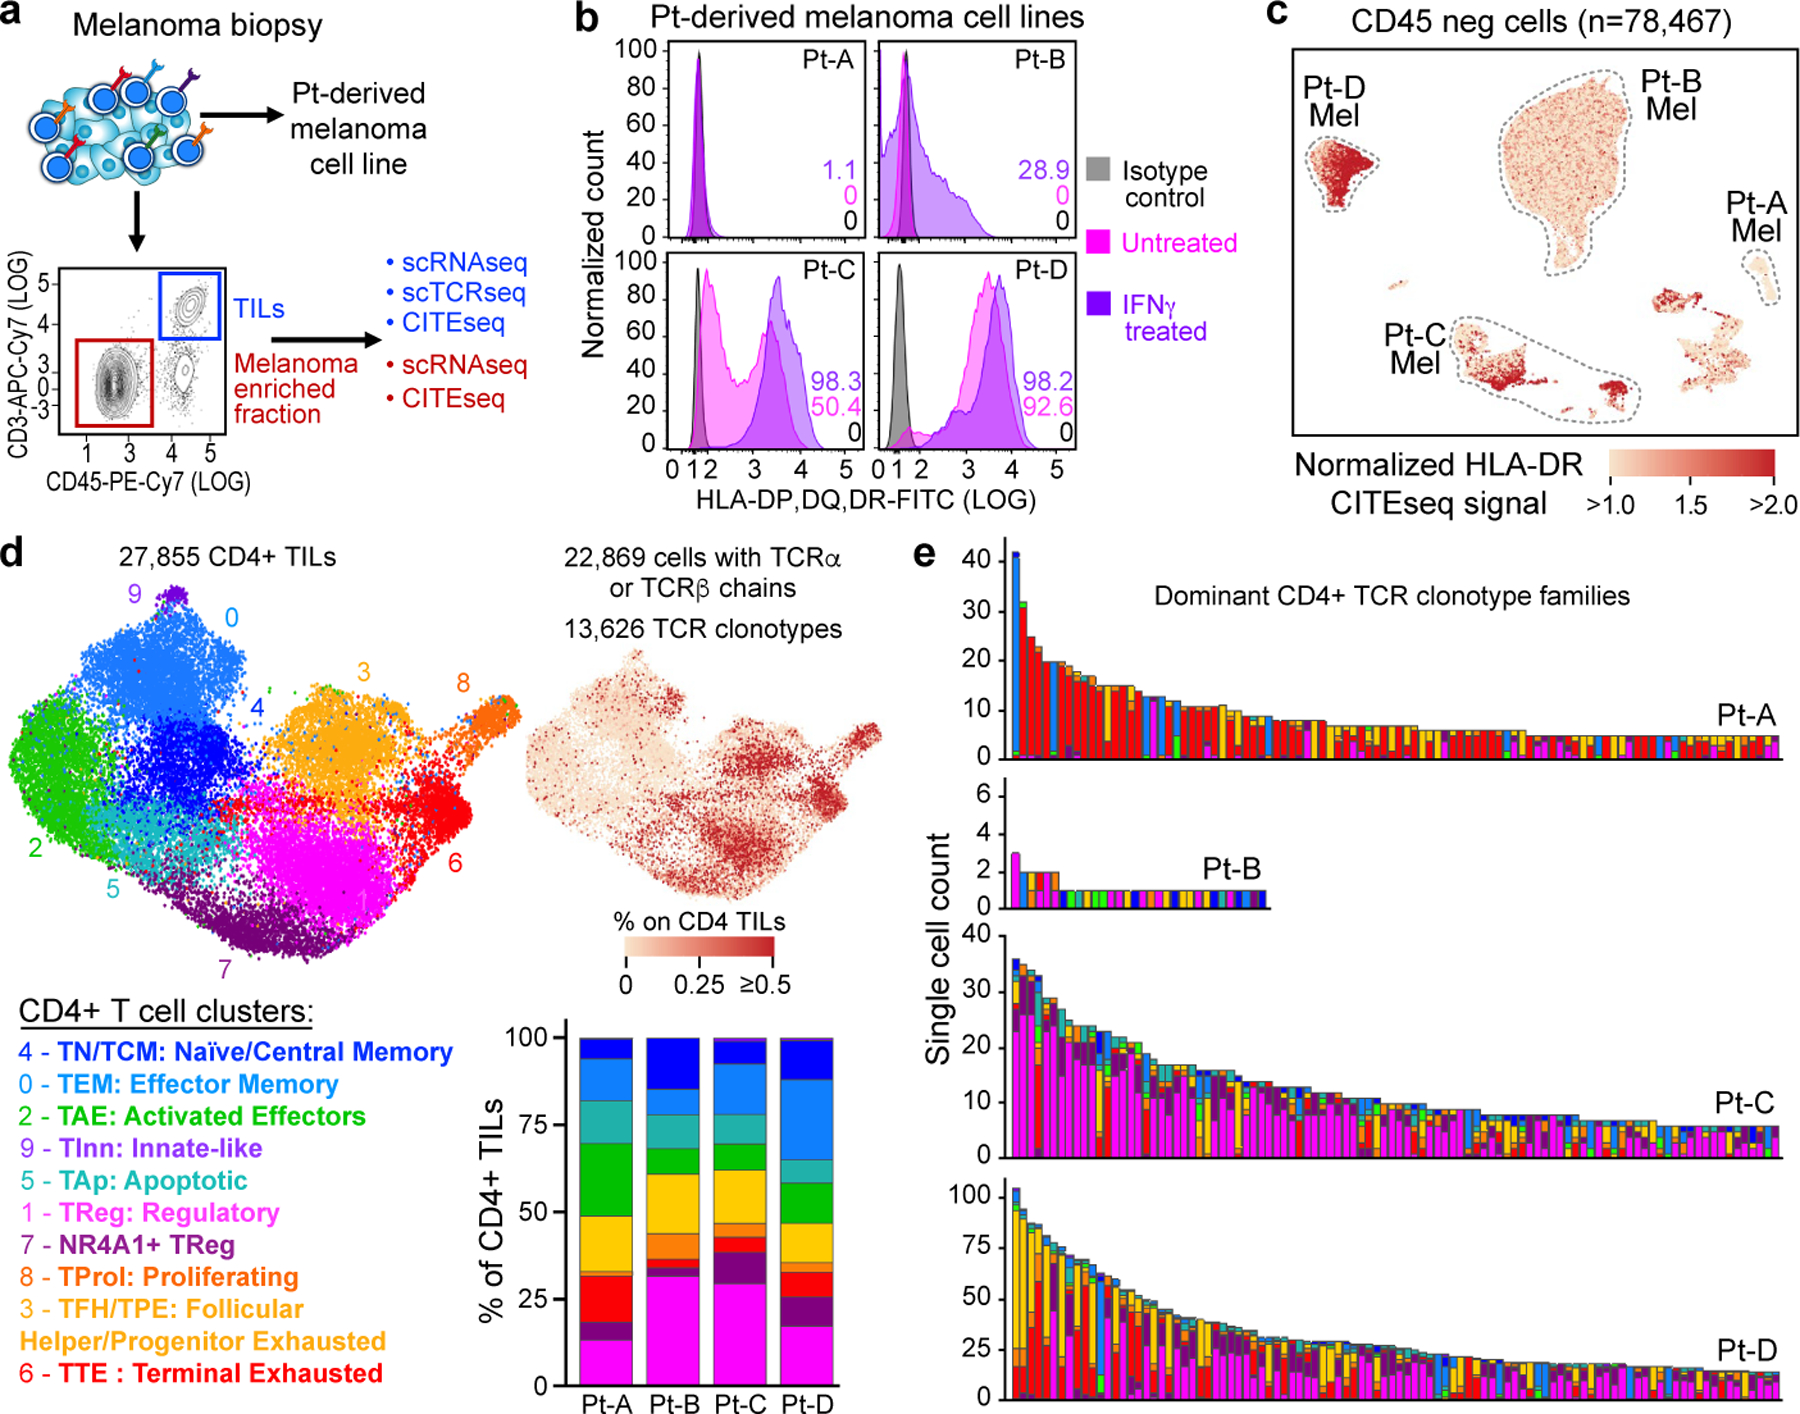
Fig. 1 |. Melanoma HLA class II expression and phenotype of CD4+ TIL TCR clonotypes.

a, Schematic of processing and single-cell sequencing analysis of melanoma samples. b, Flow cytometric assessment of HLA class II expression in 4 pdMel-CLs under basal culture conditions (magenta) or on exposure to IFNγ for 72 h (purple), compared with isotype control (grey). c, Uniform manifold approximation and projection (UMAP) of scRNA-seq data from tumour-enriched CD45− cells isolated from melanomas from four patients. Clusters of patients’ melanoma cells (Mel) were inferred on the basis of markers reported in Extended Data Fig. 1a–c. Colour indicates surface HLA-DR expression as determined by CITE-seq. d, UMAP of inferred cell states from scRNA-seq data of CD4+ TILs. Right, CD4+ TILs on the same UMAP, annotated for intra-patient TCR-clone frequency (defined by scTCR-seq). Bottom right, cluster frequencies among CD4+ TILs from the four patients. e, Cluster distribution of the top 100 CD4+ TCR clonotype families from melanomas from the four patients. Colours indicate cell states, as delineated in d.
