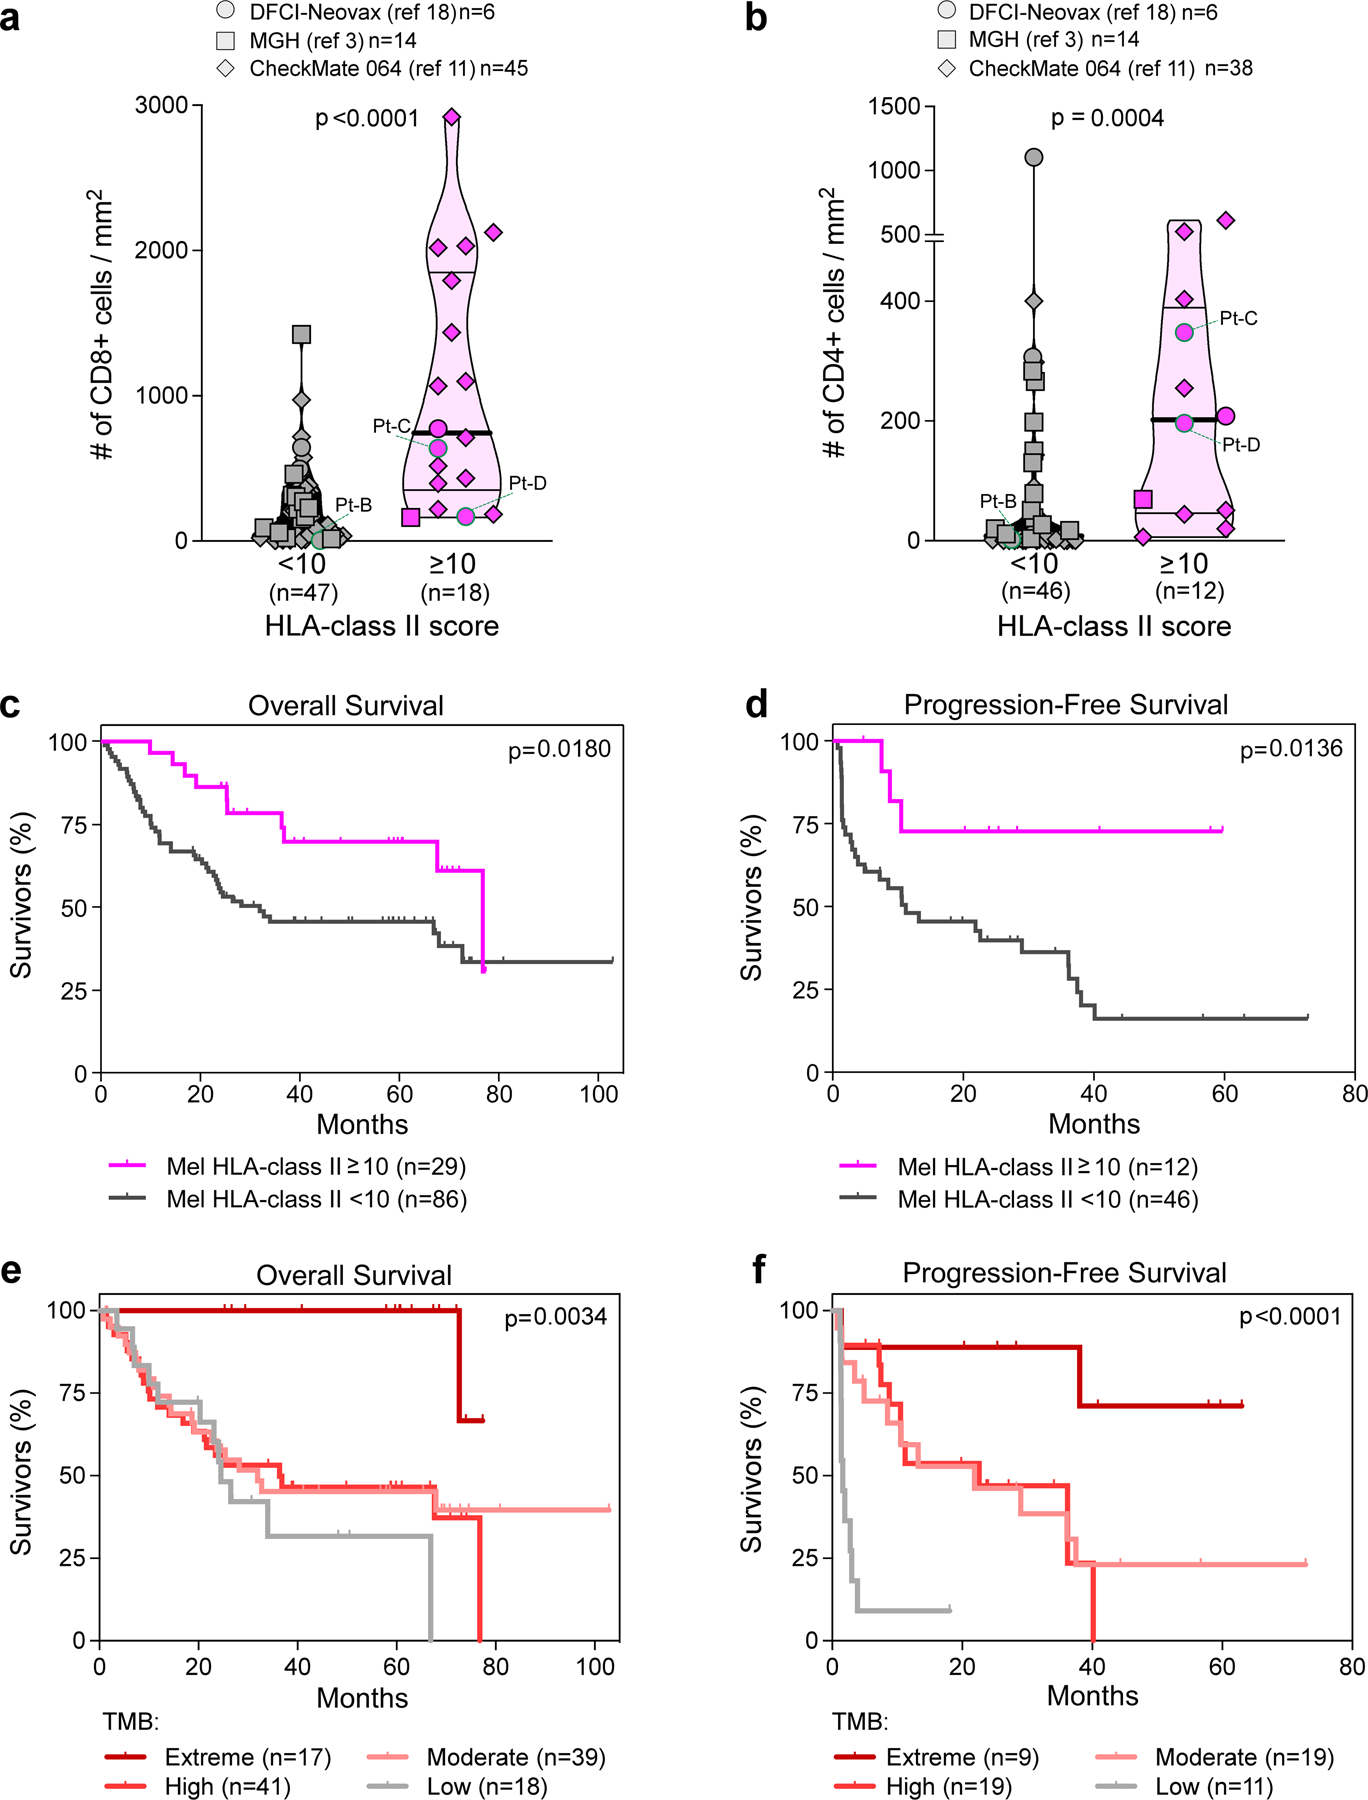
Extended Data Fig. 9 |. Quantification of TILs and clinical outcome of patients with melanoma.

a, b, Quantification of CD8+ (a) and CD4+ (b) TILs detected in tumor specimens from patients reported in cohorts from published studies3,11,18. TILs were quantified in tumor areas using immunohistochemical or immunofluorescence stainings (see Supplementary Information). Only patients with available tumor FFPE were analyzed (n indicated in the legends). Values from patients included in the discovery cohort are labeled (specimens from Pt-A were not available for this analysis). Melanoma were classified based on HLA class II expression, scored on tumor cells by IHC (≥ or < 10% of tumor cells with positive staining). Patients from each study are denoted by different symbol shapes (as reported in each legend, with number of patients for each cohort). Horizontal lines show median (bold) and quartiles values; p-values indicate the significance of comparisons calculated using Mann-Whitney test. c–f, Clinical outcome of patients with melanoma, classified based on tumor HLA class II expression (c, d) or based on classes of tumor mutation burden (e, f), as defined in Fig. 4a and indicated in each color legend. Kaplan-Meier curves estimate the overall survival (c, e) and progression-free survival (d, f) of patients with melanoma from 4 published studies3,11,18,19. Only patients with available overall survival or progression-free survival after treatment with immunotherapies have been analyzed (see Supplementary Table 8). For each category, number of analyzed patients is reported within the legends. P-values indicate the significance of comparison between Kaplan-Meier curves, as obtained using Log-rank Mantel-Cox test between 2 groups (c, d) or 4 groups (e, f).
