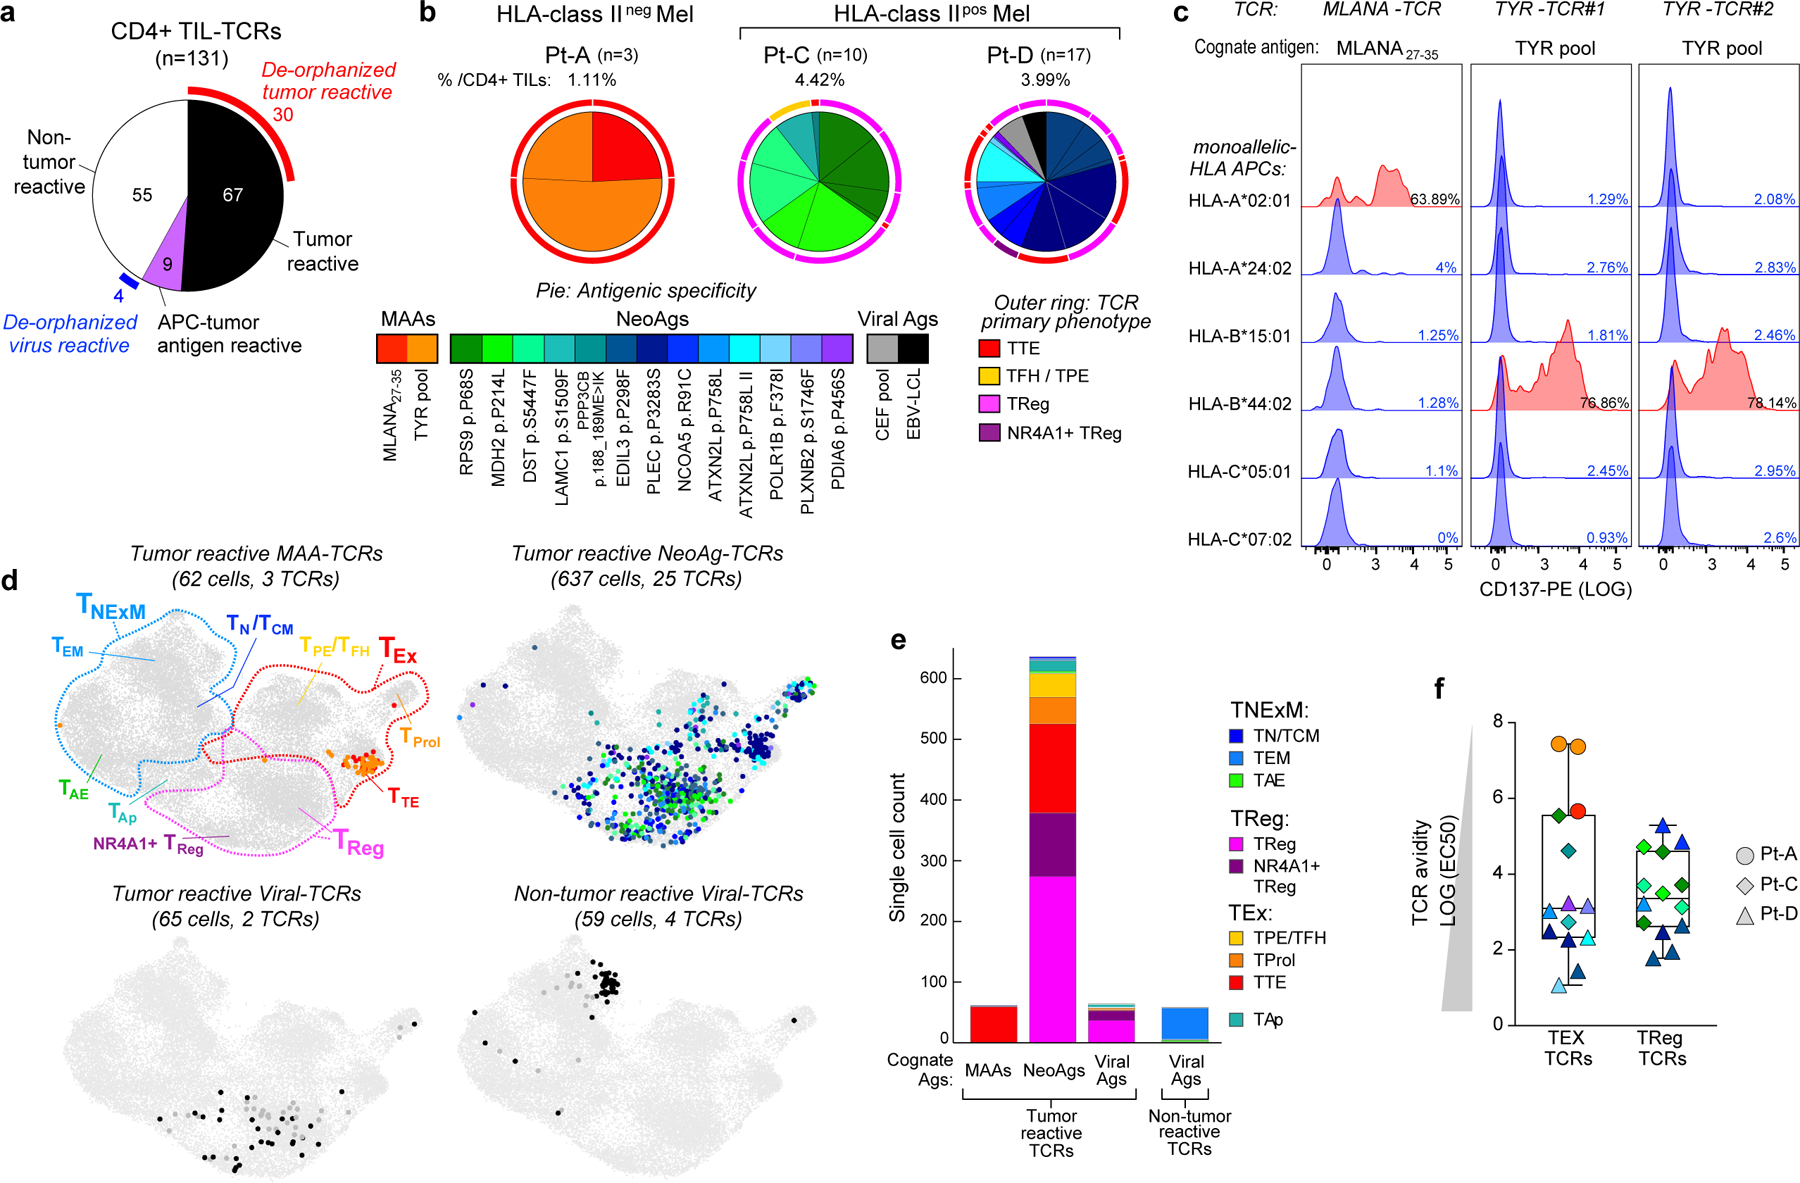
Fig. 3 |. Antigen specificity of TCRs from CD4+ TILs.

a, Pie chart summarizing the classification of 131 CD4+ TIL TCRs tested for antigen specificity in melanomas from 3 patients (Pt-A, Pt-C and Pt-D). Partial outer ring indicates TCRs with detected antigen specificity (that is, de-orphanized). b, Cognate antigens of de-orphanized antitumour TIL TCRs, showing the relative frequency of CD4+ TCR-clonotypes with MAA, neoantigen or viral antigen specificity. Numbers and total frequencies of tested TCR clonotypes among CD4+ TILs are reported above each chart. Pie colours indicate the cognate antigens of the TCR; the outer ring colours show the primary phenotype of the clonotypes. c, Deconvolution of HLA class I restriction of 3 de-orphanized tumour-specific CD4+ TCRs from Pt-A. Flow cytometry histograms depict CD137 upregulation measured on CD4+ T cells transduced with TCRs reactive to MLANA27–35 peptide (n = 1, left) or to TYR peptide pool (n = 2, right). TCRs were tested against their cognate antigen, presented by APCs stably transformed with single HLA class I alleles from Pt-A (rows). Red histograms show HLA class I restrictions capable of triggering TCR reactivity upon binding of cognate antigens. d, UMAPs of CD4+ TILs bearing antitumour TCRs specific for MAAs, neoantigens or viral antigens, or non tumour-reactive TCRs specific for viral antigens. Dot colours indicate TCR antigenic specificity corresponding to the scheme in b. TIL phenotypic clusters are delineated within the first UMAP as reference. e, Cell counts of de-orphanized tumour-reactive or non tumour-reactive CD4+ TCR clonotypes specific for different types of cognate antigens (MAAs, neoantigens and viral antigens). Colours show cell states, as inferred by scRNA-seq (Fig. 1c). f, Comparison of avidities of de-orphanized antitumour TIL TCRs with TEx (n = 14) or TReg (n = 14) phenotypes. Dot colours show TCR cognate antigens; colour scheme as in b. The shapes indicate the patient in whom the TCRs were detected. Whiskers extend from minimum to maximum values; horizontal bars represent the median and boxes encompass 25th–75th percentiles.
