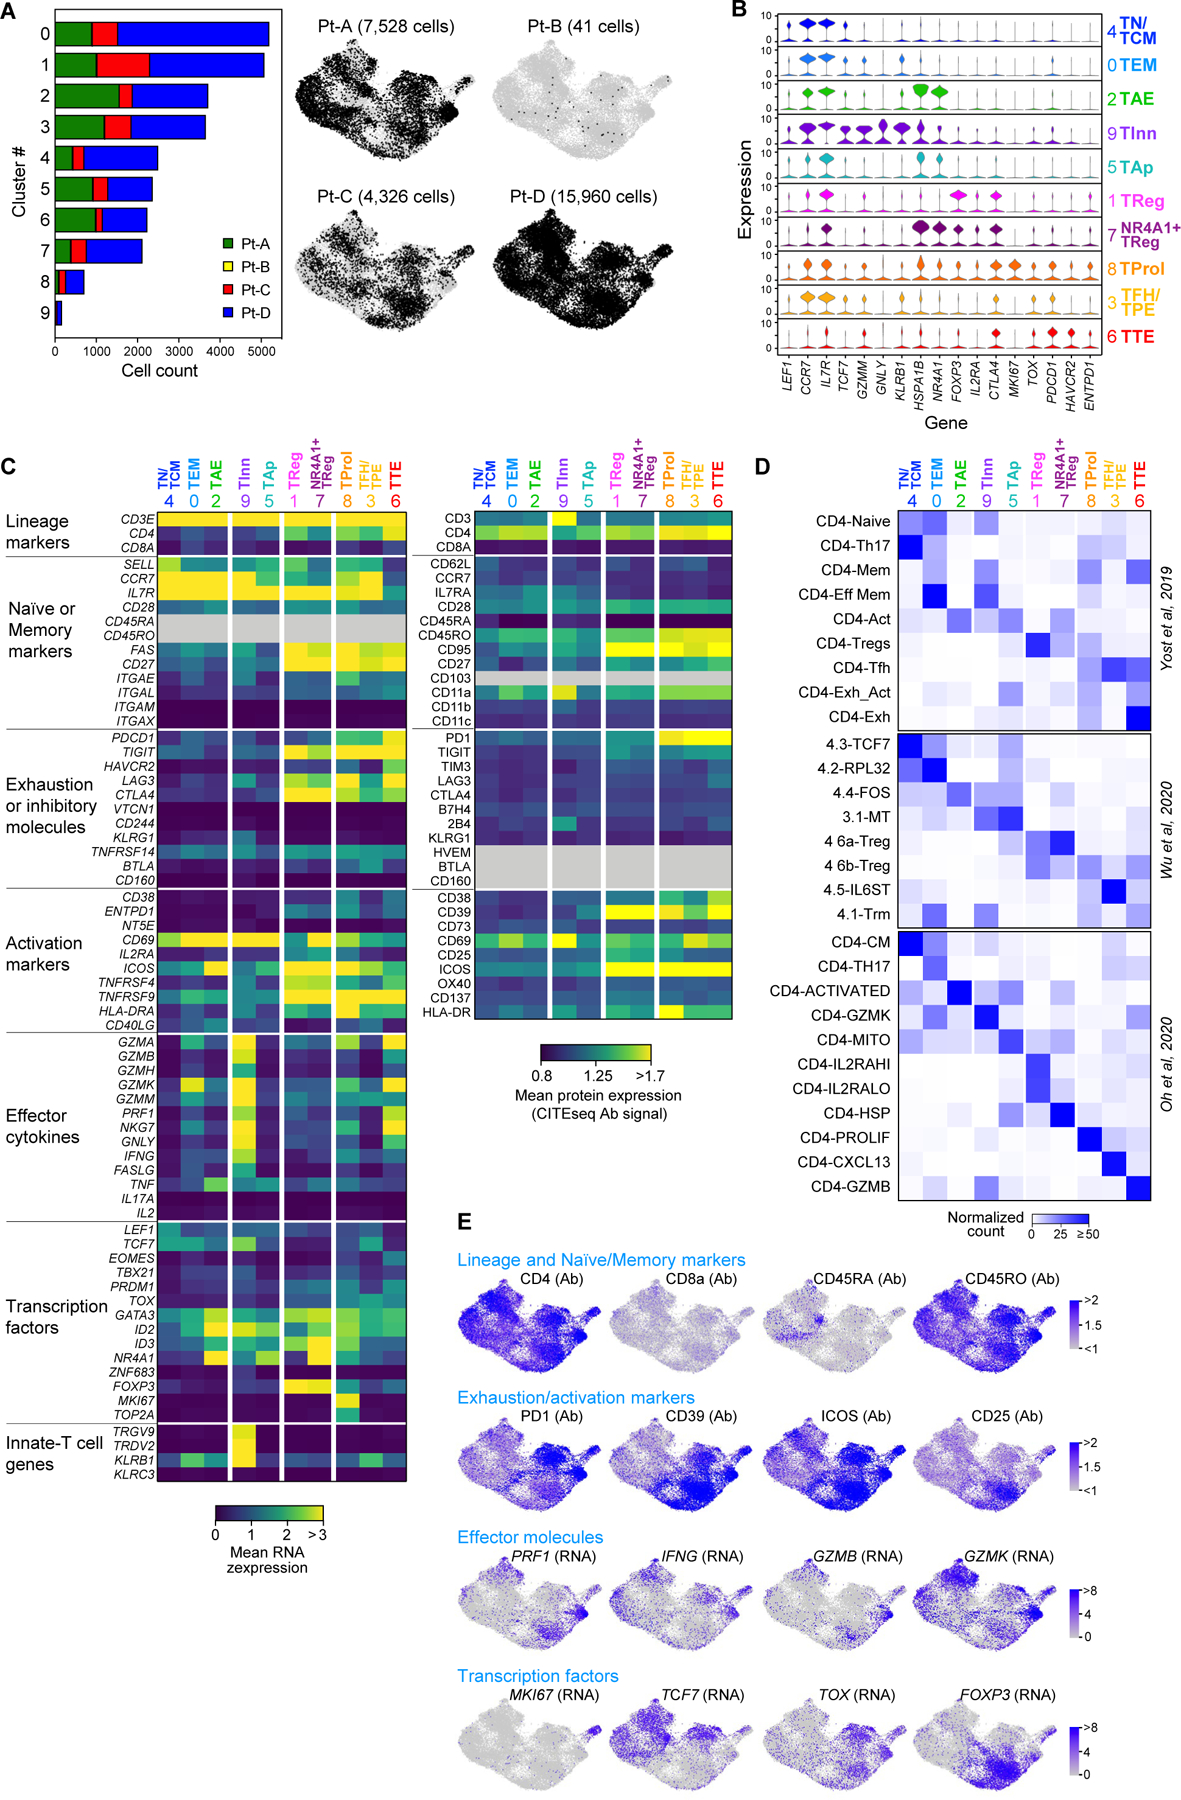
Extended Data Fig. 2 |.

Single-cell profiling of CD4+ tumor infiltrating lymphocytes. a, Size and patient distribution of the 10 clusters identified from CD4+TIL scRNA-seq. Left: per cluster, patient origin is denoted by color. Right: UMAPs depicting cluster distribution of patient-specific CD4+TILs. b, Violin plots quantifying relative transcriptional expression of genes (columns) with high differential expression among CD4+TIL clusters (rows). c, Heatmaps depicting the mean cluster expression of a panel of T cell related genes, measured by scRNA-seq (left panel) and the mean surface expression of the corresponding proteins measured through CITE-seq (right panel). Clusters (columns) are labelled using the annotation provided in Fig. 1d; markers (rows) are grouped based on their biological function. Grey - unevaluable markers (CD45 isoforms for scRNA-seq) or which were not assessed (for CITE-seq). CITE- seq CD3 surface expression was poorly detected because of the presence of competing anti-CD3 sorting antibody. d, Characterization of the CD4+TIL clusters using independent reference gene-signatures4–6. Heatmaps show cross-labelling of T cell clusters defined in the present study (columns, reported as in Fig. 1d) versus reference gene-signatures (rows) derived from the analyses in Yost et al.4, Wu et al.5 and Oh et al.6, with intensities indicating normalized frequency. e, UMAPs depicting the single-cell expression of representative T cell markers among CD4+TILs either through detection of surface protein expression with CITE-seq (Ab), or through scRNA-seq (RNA).
