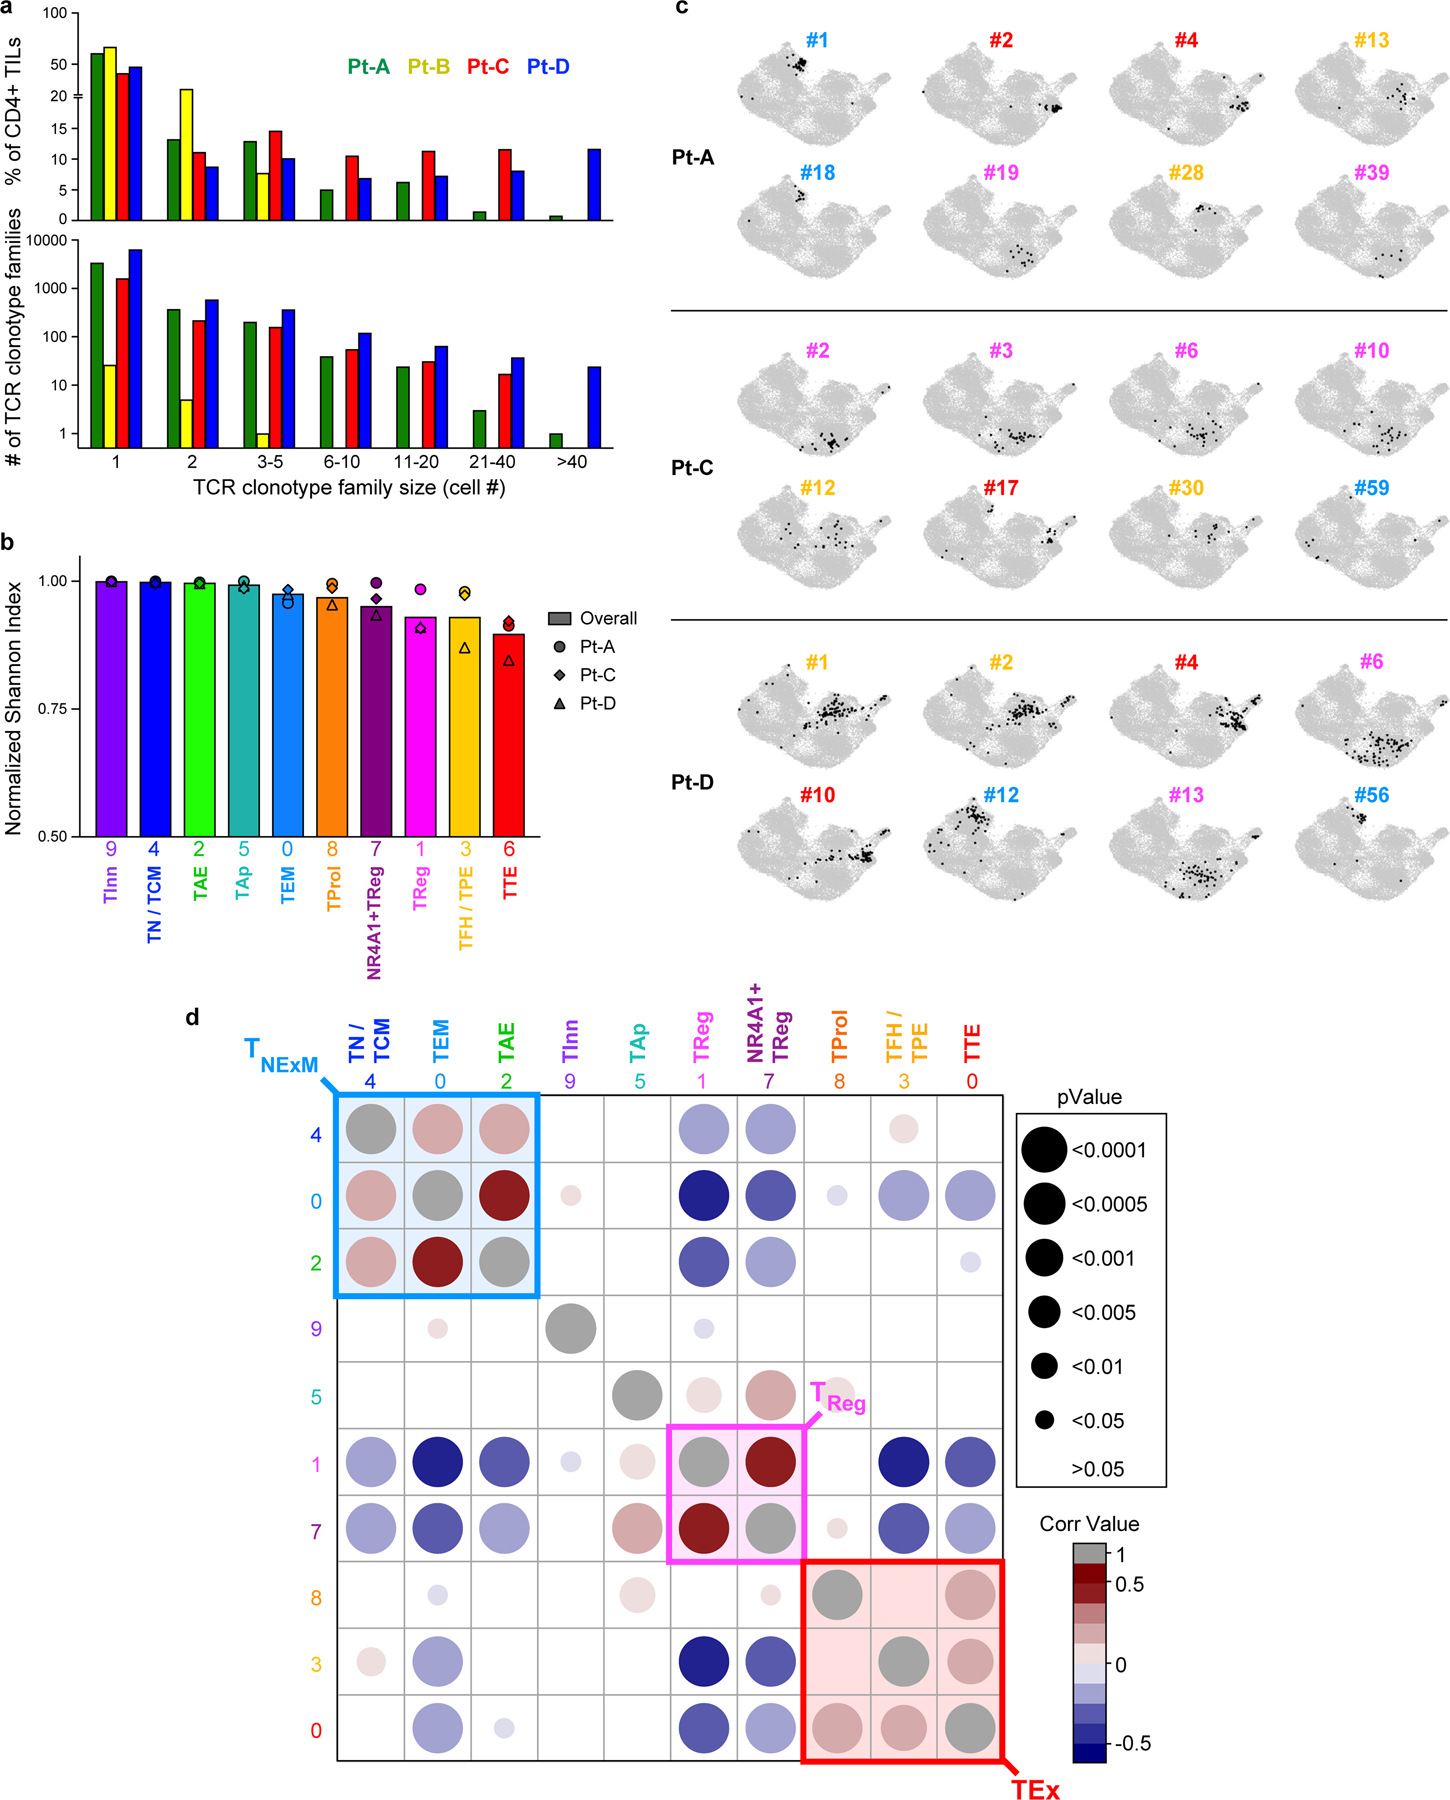
Extended Data Fig. 3 |. Clonality of CD4+TILs and cell states of TCR clonotypes.

a, Histograms depicting the number (bottom panel) and overall frequency (top panel) of patients’ TCR clonotype families divided in categories based on their size (x axis). b, Histograms showing the intra-cluster TCR clonality, calculated for CD4+ T cells in each cluster (x axis) using normalized Shannon index. Symbols - individual TCR clonality for the 3 patients with high numbers of TILs (Pt-A, Pt-C, Pt-D). Bars - the overall TCR clonality measured within each cluster. c, UMAPs of the cluster distribution of representative dominant TCR clonotype families among CD4+TILs from TIL-rich patients (n = 3). For each patient, numbers denote the ranking of each TCR clonotype (see Fig. 1e), while colors identify their primary cluster (see Fig. 1d). d, Matrix displaying Spearman correlation of normalized cluster distribution of dominant TCR clonotype families composed by ≥4 cells. Colors and area of the circles indicate the strength and significance of the correlation, respectively.
