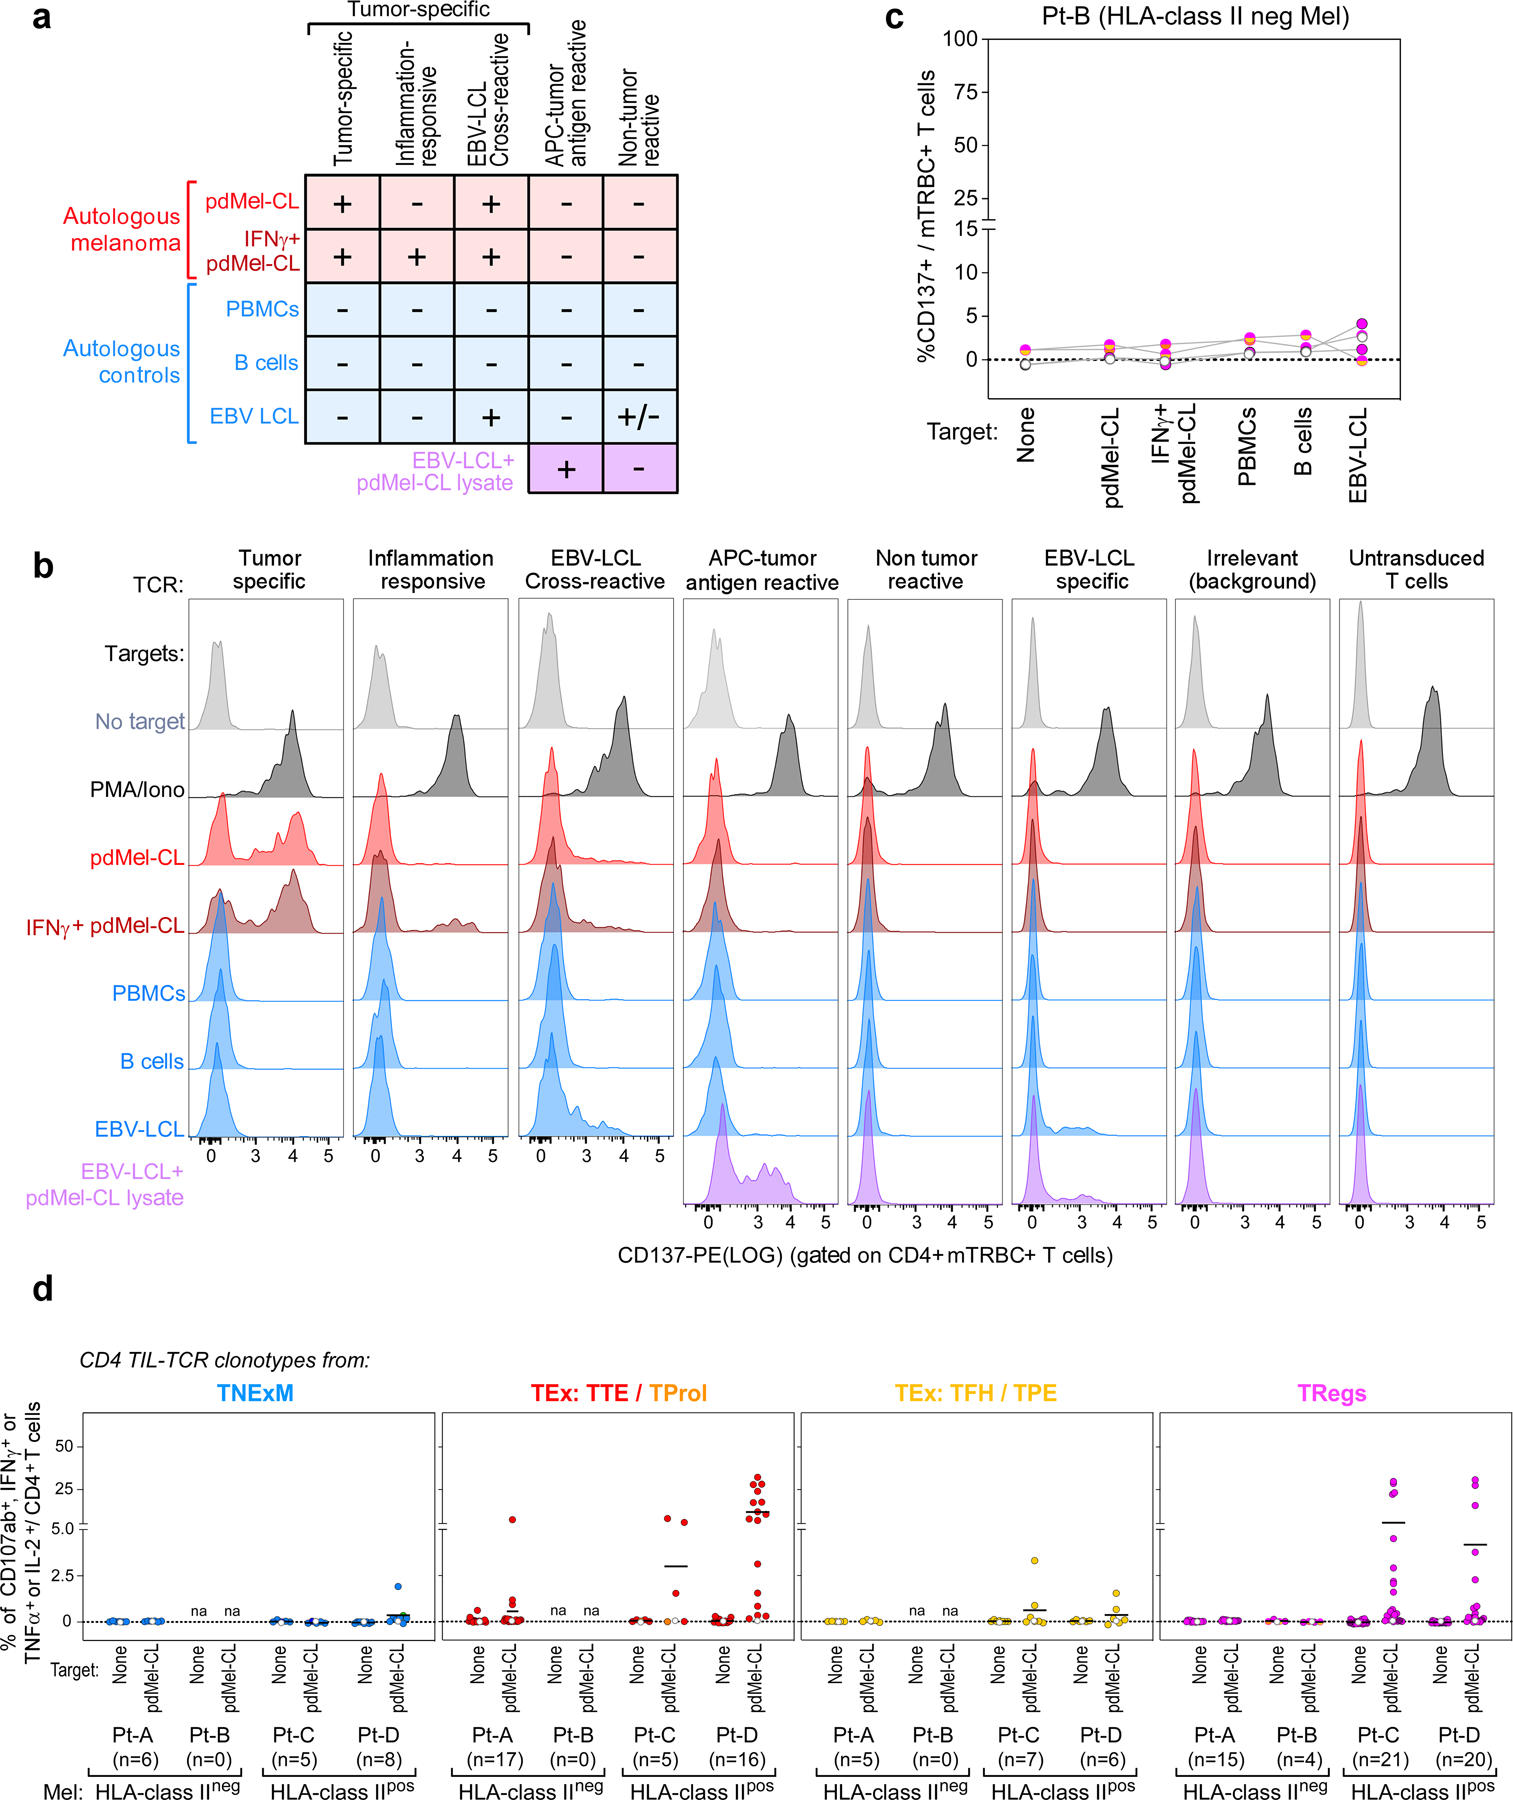
Extended Data Fig. 4 |. Antitumor reactivity of in vitro reconstructed TCRs.

a, Schema for classification of TCR reactivities based on CD137 upregulation of TCR transduced T cell lines upon challenge with patient-derived melanoma cells (pdMel-CLs, with or without IFNγ pre-treatment [red]), with controls (PBMCs, B cells and EBV-LCLs [blue]), or with EBV-LCLs pulsed with tumor lysate (purple). b, Representative flow cytometry plots depicting CD137 upregulation measured on CD4+ T cells transduced with TCRs isolated from CD4+ melanoma TILs and cultured with melanoma or control targets. Background reactivity was estimated by measuring CD137 upregulation on CD4+ T cells transduced with an irrelevant TCR. c, TCR reactivities from Pt-B, measured on TCR transduced (mTRBC+) CD4+ lymphocytes cultured alone or with patient- derived target cells. Background activation measured on CD4+ T cells transduced with an irrelevant TCR was subtracted. Each dot-line set represents the behavior of a single TCR; dot colors denote cell states of TCR clonotypes, as delineated in Fig. 1c; white dots show background signal of untransduced CD4+ T cells. d, Cytotoxic potential provided by TCRs isolated from all 4 studied melanoma patients and reconstructed from memory clusters (blue), from TTE and TProl exhausted clusters (red), from TFH/TPE exhausted clusters (yellow) or from TReg clusters (magenta). Degranulation (CD107a/b+) and concomitant production of cytokines (IFNγ, TNFα and IL-2) were assessed through intracellular staining, gating on TCR-transduced (mTRBC+) CD4+ T cells cultured alone or in the presence of autologous melanoma (pdMel-CLs). Each dot represents the result for a single TCR isolated from CD4+TILs, color-coded based to its primary phenotypic cluster (as defined in Fig. 1d). For each analyzed TCR, background cytotoxicity from CD4+ T cells transduced with an irrelevant TCR was subtracted. White dots - basal level of activation of untransduced cells. Overall, these data indicate that antitumor cytotoxicity mainly resides among TCR clonotypes with exhausted and regulatory primary clusters.
