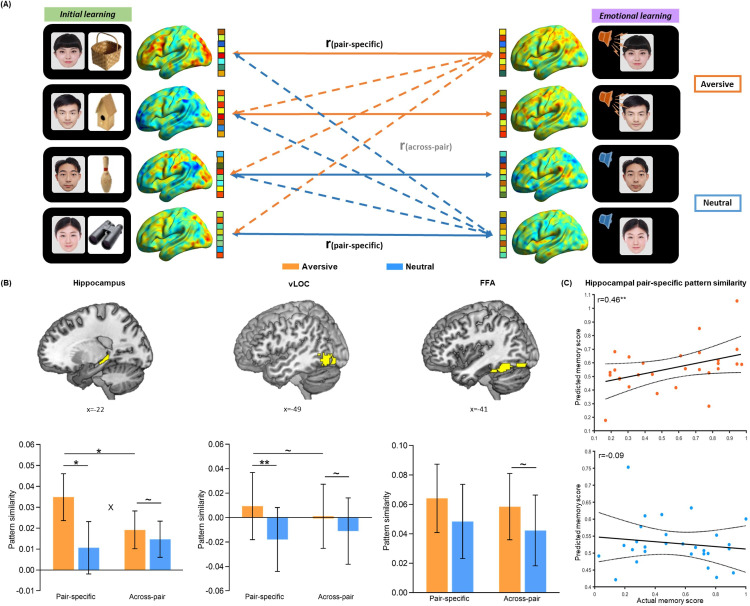
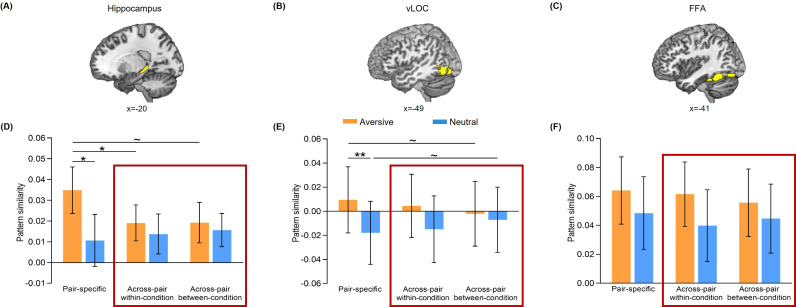
Figure 2. Trial-level neural reactivation of initial learning activity during emotional learning.
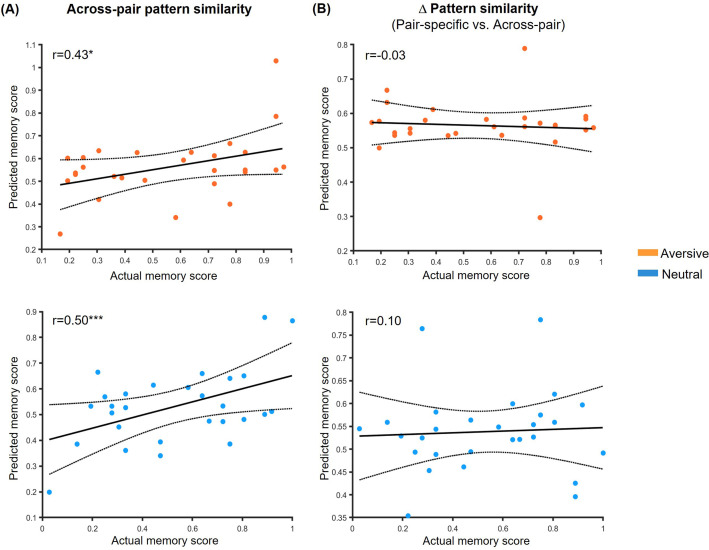
(A) An illustration of trial-level reactivation analysis. Example data was from one subject. During initial learning (left), sagittal views of activation maps for four trials were shown. During emotional learning (right), sagittal views of activation maps for the corresponding trials with two in aversive condition and two in neutral condition were shown. Solid lines indicate correlations for pair-specific similarity measure and dash lines indicate correlations for across-pair similarity measure. These correlations from each similarity measure were then averaged across trials for each participant in aversive and neutral conditions separately. (B) Bar graphs depict the average pair-specific and across-pair pattern similarities in aversive and neutral conditions for the bilateral hippocampus (left), bilateral ventral LOC (vLOC, middle) and bilateral FFA (right) ROIs. ‘X’ indicates a significant interaction (p<0.05). Error bars represent standard error of mean (n=28). (C) Scatter plots depict correlations of observed associative memory performance (i.e. remembered with high confidence) with predicted memory outcome from machine learning prediction analysis based on hippocampal pair-specific pattern similarity in aversive and neutral conditions. Dashed lines indicate 95% confidence intervals, and solid lines indicate the best linear fit. Dots represent data from each participant (n=28). Notes: ~p < 0.10; *p<0.05; **p<0.01; two-tailed tests.

