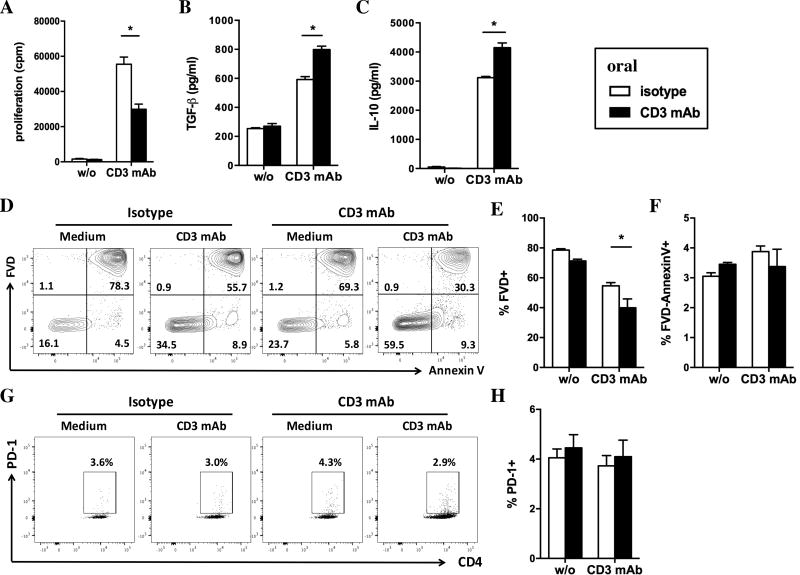
Figure 2. In vitro analysis of spleen cells after five days of oral CD3-specific mAb.
A. Proliferation of splenocytes from CD3 mAb fed mice (black bars) as compared to isotype fed mice (white bars) after 72 hrs stimulation with of CD3-specific mAb in vitro (1 µg/ml). B–C. Concentration of TGF-β (B) and IL-10 (C) in the supernatant of spleen cells from CD3 mAb fed as compared to isotype fed mice after 48 hrs stimulation with CD3-specific mAb. D–G. Analysis of cell death (D, E) and apoptosis (D, G) in splenic T cells from CD3 mAb fed mice as compared to isotype fed mice after 48 hrs stimulation with of CD3-specific mAb in vitro (gated on lymphocytes). Dead cells were detected using a fixable viability dye (FVD; D, E) and apoptotic cells were defined at FVD-AnnexinV+ (F). PD-1 staining on CD4+ T cells after 48 hrs of stimulation with CD3-specific mAb. Results are shown as mean ± SEM (n=3–4). In all panels black bars represent cells from anti-CD3 mAb fed mice whereas white bars show data from isotype control fed mice. Statistically significant results are indicated: *p<0.05, ** p<0.01, ***p<0.001.

