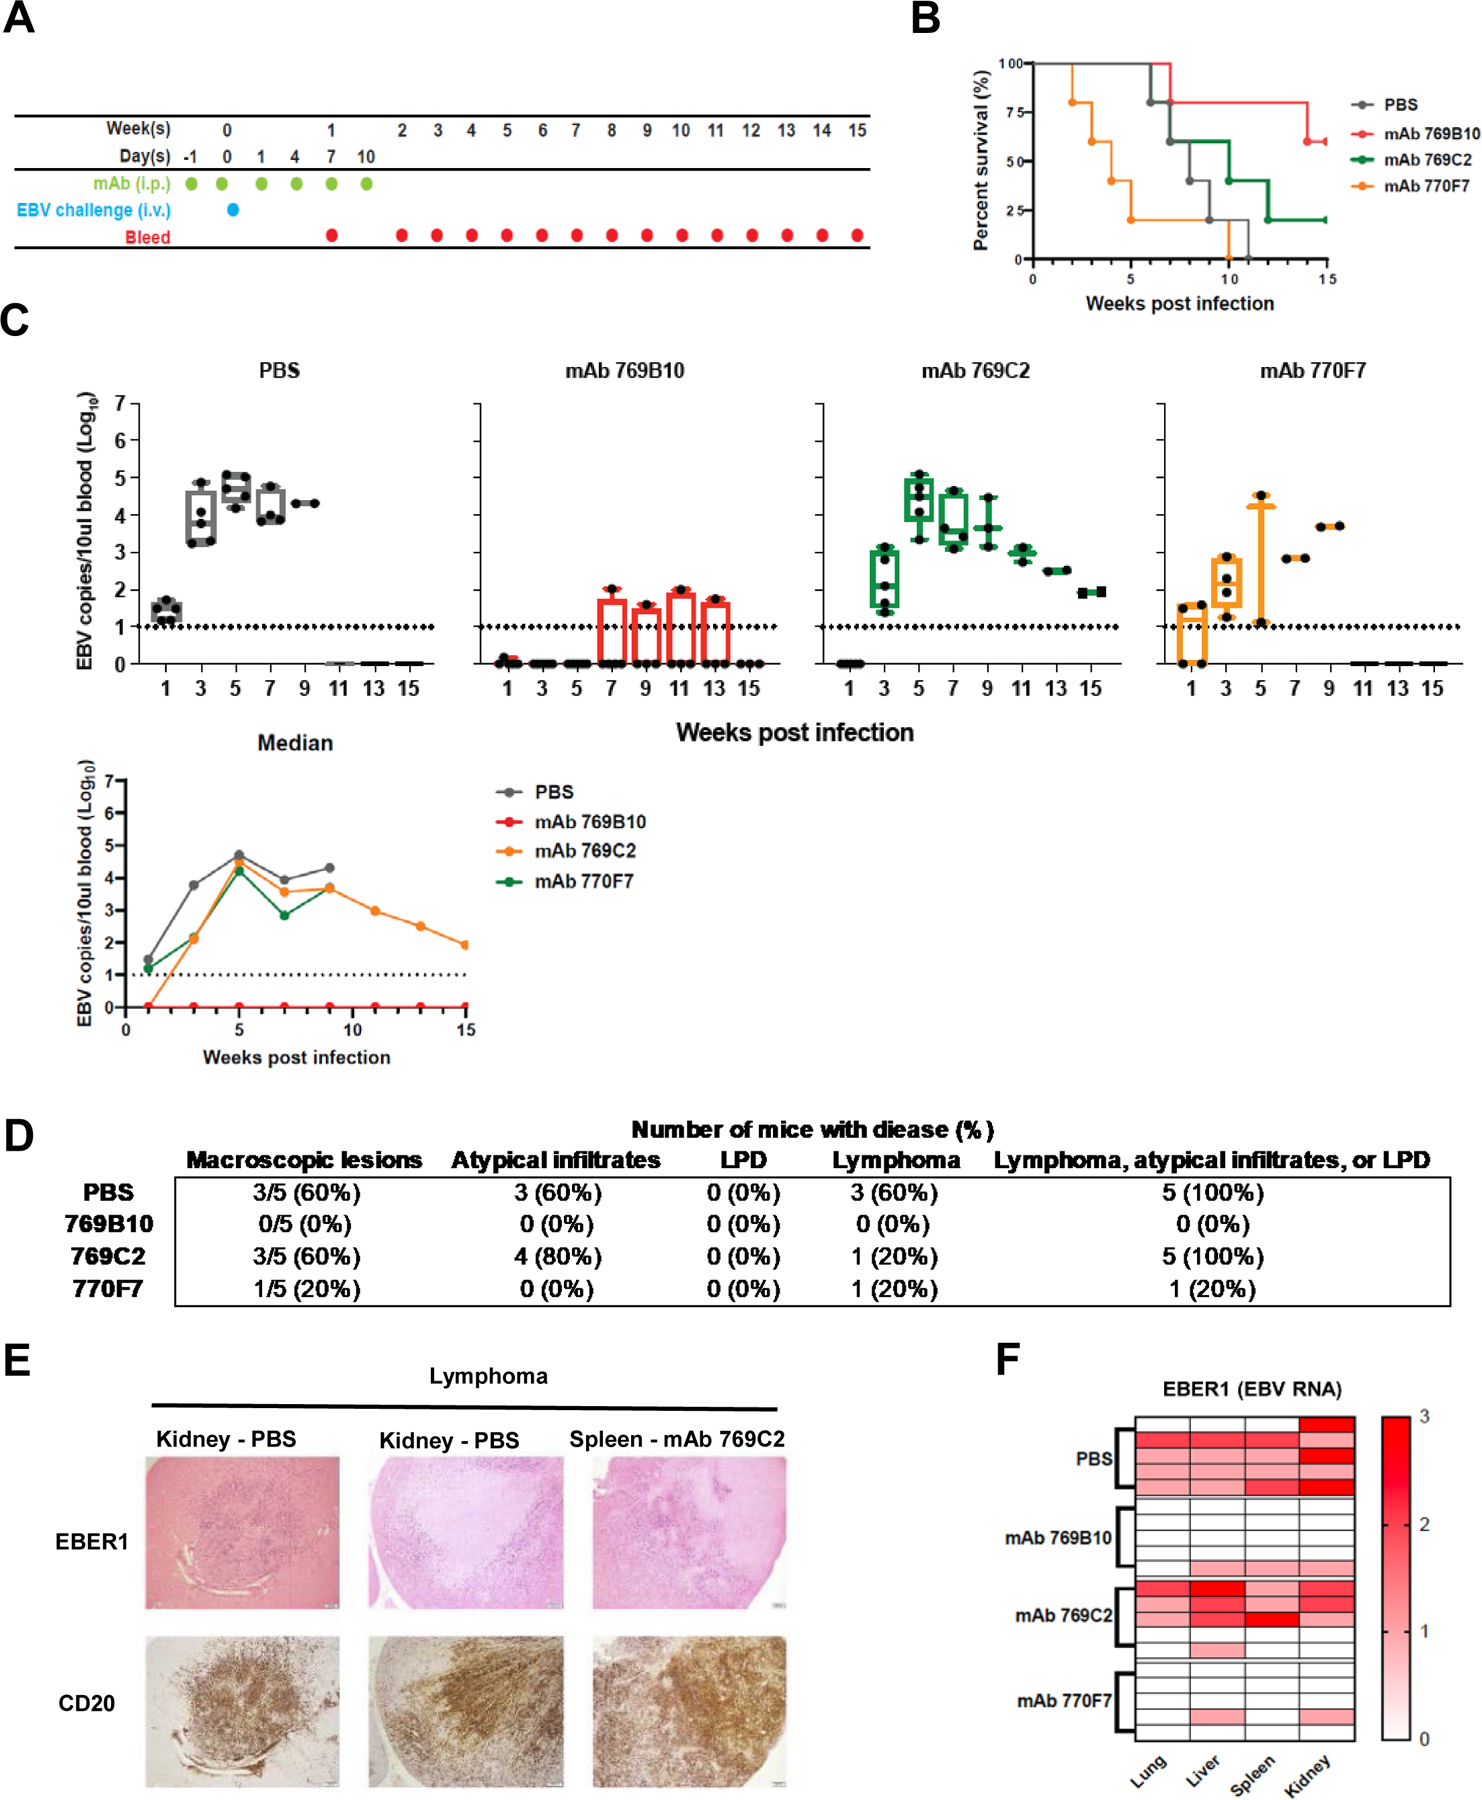
Figure 7. Passive transfer of gH/gL mAbs in humanized mice and challenge with EBV.

(A) Mice were given six doses of gH/gL mAbs 769C2, 770F7, 769B10, or PBS intraperitoneally and challenged intravenously with EBV after the second dose of mAb.
(B) Survival rate for each group of mice after challenge.
(C) EBV DNA copies in the blood was quantified by real-time qPCR. Each dot represents one mouse and the dotted line indicates the detection limit of the assay. Whiskers indicates minimum and maximum data points and box represents upper and lower quartiles; the horizontal line in the box is the median. Median EBV DNA copies in the blood were calculated.
(D) Number and percent of animals in each treatment group with macroscopic lesions on the surface of liver, kidney, spleen, or lung, and with microscopic lesions in these organs showing lymphoma, atypical B cell infiltrates, or lymphoproliferative lesions that do not meet the criteria for lymphoma.
(E) Representative images of lymphoma in the kidneys, spleen, and lungs of the mice. Treatment groups are indicated. In situ hybridization was performed for EBV EBER1 with eosin counterstain (upper panel) and CD20 staining for human B cells using 3,3’ diaminobenzidine as a chromogen (lower panel).
(F) Heatmap of EBER1 expression in lung, liver, spleen, and kidney in mouse. A score of 0 indicates no EBER1 expression, 1 represents scattered EBER+ cells, 2 indicates a moderate number of EBER+ cells, 3 represents intense infiltration of the tissue with EBER+ cells.
See also Figures S6-S7.
