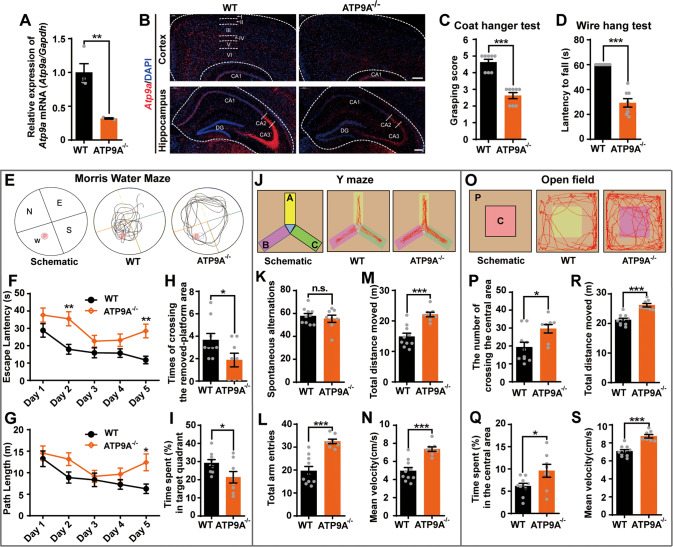
Fig. 2. Atp9a null mice show muscle weakness, memory impairment and hyperkinetic movement disorders.
Atp9a gene knockout mice (ATP9A−/−) were engineered using CRISPR/Cas9 technology. A Atp9a mRNA transcription in mouse brain was detected by RT-qPCR (n > 3). B Representative images of Atp9a mRNA transcription (red) in mouse cerebral cortex and hippocampus were detected by in situ hybridization. Scale bar, 200 μm. Two-month-old mice, half male and half female, were used for all behavioral tests. Muscle strength of mice was evaluated using coat hanger tests (C) and wire hang tests (D) (n = 8). E–I MWM tests were conducted including a 5-day navigation test and a spatial probe test on day 6. A schematic of the MWM and representative mouse movement tracks at day 6 (E), escape latency (F) and path length (G) over 5 days are shown. P: platform; N, E, S and W represent the four quadrants. The times of crossing the removed-platform area (H) and the percentage of time mice spent in the target quadrant (I) were assessed in a spatial probe test (n > 8). J A schematic of the Y-maze test and the representative movement tracks of mice are shown. A, B and C represent three different maze arms. Spontaneous alternations (K), total arm entries (L), total distance moved (M) and mean velocity (N) of mice were assessed in the Y-maze test (n > 8). O Schematic representation of the open-field tests and the representative movement tracks of mice. P: peripheral area; C: central area. Number of crossing the central area (P) and time spent in the central area (Q), the total distance moved (R) and mean velocity (S) of the mice were evaluated in the open-field test (n > 8). All values are presented as mean ± SEM (*P < 0.05, **P < 0.01, and ***P < 0.001, unpaired t-test for A, C, D, H, I, K–N, P–S, and two-way ANOVA with Bonferroni post hoc test for F and G).

