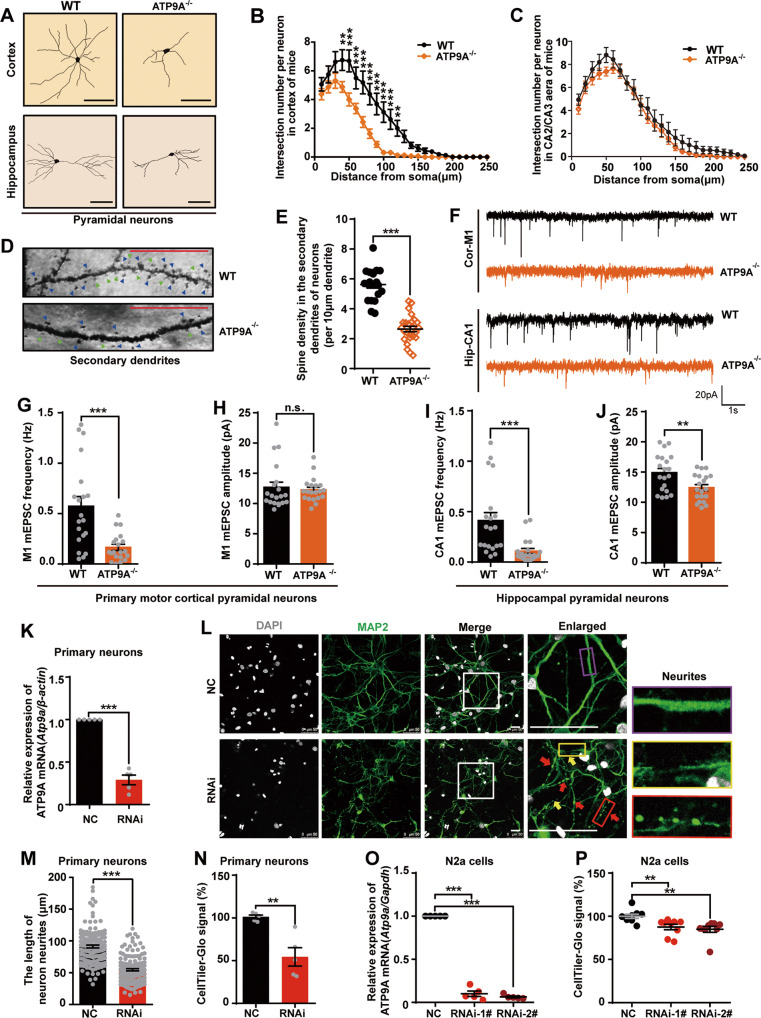
Fig. 3. ATP9A is required for the maintenance of neuronal neurite morphology, synaptic transmission and cell survival.
A–E Golgi staining was conducted on half of the mouse brains after the behavioral tests. Pyramidal neurons from the fifth- layer of the mouse motor cortex and the CA1 region of the hippocampus were studied for Sholl analysis after Golgi staining. A A schematic of the dendritic morphology of pyramidal neurons in mouse motor cortex and hippocampus. Scale bar, 100 μm. B, C The intersection number per neuron in mouse motor cortex (B, n = 16 neurons from 6 mice/genotype) and hippocampus (C, n = 16 neurons from 6 mice/genotype) was calculated. Representative images of secondary dendritic spines (D) and spine density (E) in mouse pyramidal neurons (n > 14). Blue triangles indicate mature spines and green triangles indicate immature spines. Scale bar, 20 μm. F–J Pyramidal neurons in primary motor cortex (Cor-M1) and the hippocampus (Hip-CA1) were clamped in whole-cell configuration. Miniature excitatory postsynaptic currents (mEPSCs) were recorded. F Representative mEPSC traces. Scale bars, 20 pA and 1 s. Neurons (n = 20) from 5 WT and 5 ATP9A−/− mice in the primary motor cortical region M1 (G, H). Neurons (n = 20) from 5 WT and 5 ATP9A−/− mice in the hippocampal CA1 region (I, J). K–N Atp9a knockdown was performed by siRNA transfection in DIV5 rat primary cortical neurons and N2a cells. (K) Atp9a mRNA expression in rat primary cortical neurons was detected by RT-qPCR after transfection for 48 h (n = 5). L Representative images show that ATP9A knockdown leads to neurite fracture and retraction. The white boxes in the overview images are enlarged on the right, the yellow arrows and box show the fractured neurites and the red arrows and box show the beading change of neurites in ATP9A-depleted primary cortical neurons, and the normal morphology of neurites is shown in the purple box. Scale bar, 50 μm. M Neuron neurites length (more than 50 cells from 8 fields) was measured by ImageJ. N Cell viability of rat primary cortical neurons (n = 5) was determined using a CellTiter-Glo® Luminescent Kit. Atp9a mRNA expression (O, n = 5) and cell viability (P, n = 9) of N2a cells are shown. All values are presented as mean ± SEM (*P < 0.05, **P < 0.01, and ***P < 0.001, two-way ANOVA with Bonferroni post hoc test for B and C; unpaired t-test for E, G–J, K, M and N; one-way ANOVA with Bonferroni post hoc test for O and P).

