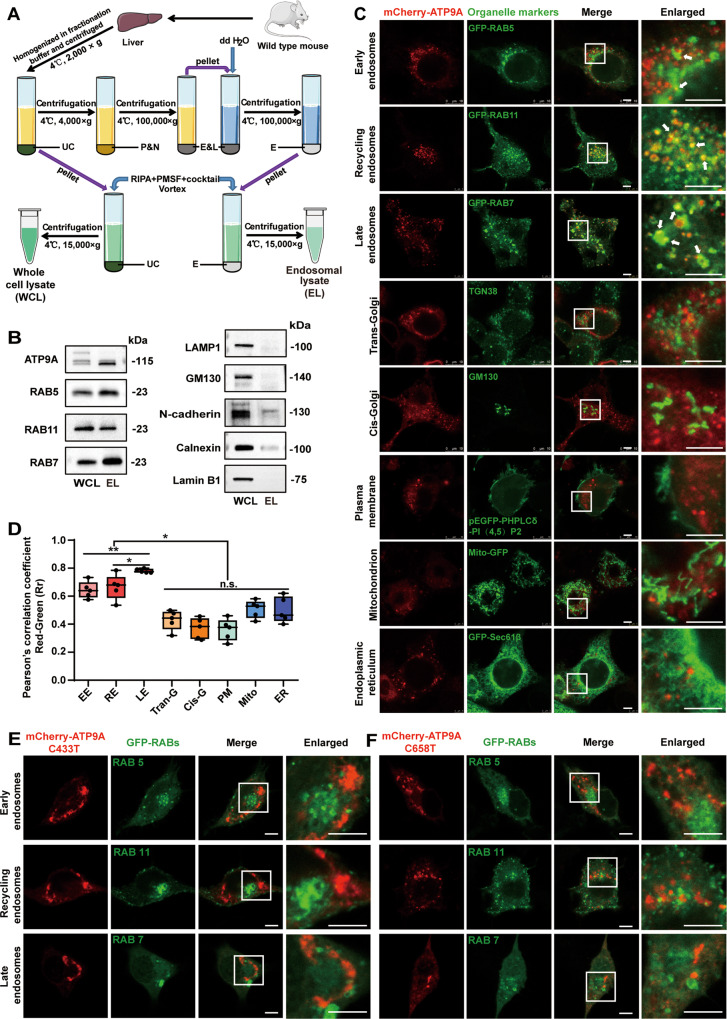
Fig. 4. ATP9A mainly localizes to endosomes, and pathogenic mutants of ATP9A form intracellular aggregates and exhibit altered intracellular distribution.
A, B Crude endosomes were isolated from fresh mouse liver by sucrose gradient centrifugation. A Schematic representation of the extraction protocol for crude endosomes. B ATP9A and organelle markers were analyzed in tissue lysate or endosome components by immunoblotting. C, D Colocalization of ATP9A and organelles in the mCherry-ATP9A-transfected N2a cells was observed by confocal microscopy. Representative immunofluorescence images are shown (C). The white boxes in the overview images are enlarged on the right, and the white arrows indicate colocalization of ATP9A and organelles. D Pearson’s correlation coefficient was applied using Image-Pro Plus to test a correlation between mCherry-tagged ATP9A (red) and organelles (green) (5 randomly selected boxes). Scale bar, 10 μm. (E, F) The mCherry-tagged ATP9A pathogenic mutants were co-transfected with RAB5-GFP, RAB7-GFP or RAB11-GFP in N2a cells. Colocalization of ATP9A pathogenic mutants (C433>T, E; C658>T, F) with RABs in N2a cells was observed by confocal microscopy. Scale bar, 10 μm. Colocalization of ATP9A mutants with RABs on the light blue line in the merged images was analyzed by line profile using ImageJ software and shown on the right. All values are presented as mean ± SEM (*P < 0.05 and **P < 0.01, one-way ANOVA with Bonferroni’s post hoc test for B). EE early endosomes, RE recycling endosomes, LE late endosomes, Trans-G trans-Golgi network, Cis-G cis-Golgi, PM plasma membrane, UC pellet debris and undestroyed cells, P&N plasma membrane and nuclei, E&L endosomes and lysosomes, E endosomes, WCL whole-cell lysate, EL endosomal lysate.

