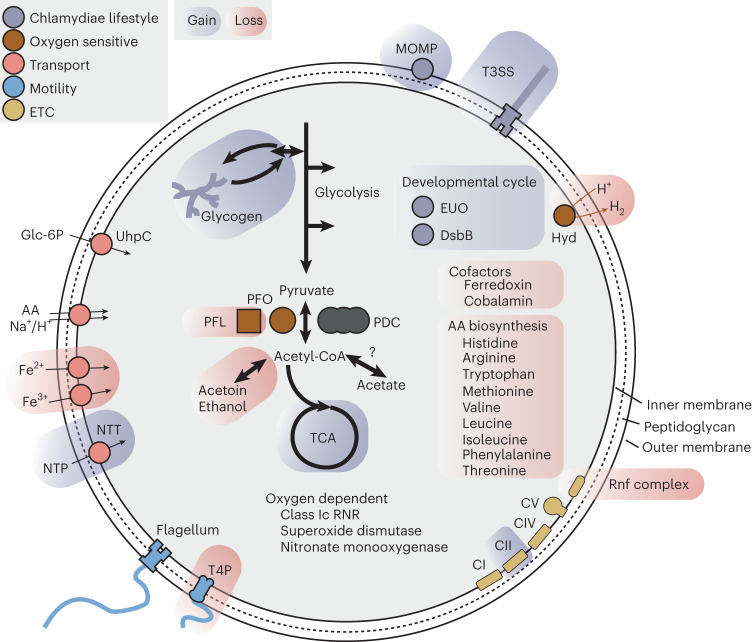
Fig. 2. Schematic of gene content reconstructed in LCCA.
Gains and losses in LCCA relative to LVCCA are indicated by blue and red backgrounds, respectively. The reconstructed presence of a peptidoglycan-based cell wall is indicated by the dashed line between inner and outer membranes. ADI, arginine deiminase pathway; CI–V, electron transport chain complexes I–V; Hyd, [FeFe]-hydrogenase; PDC, pyruvate dehydrogenase; T4P, type IV pilus. See also Extended Data Fig. 2 for a more detailed summary and Supplementary Data 9 for gene content reconstructed in LCCA and LVCCA.

