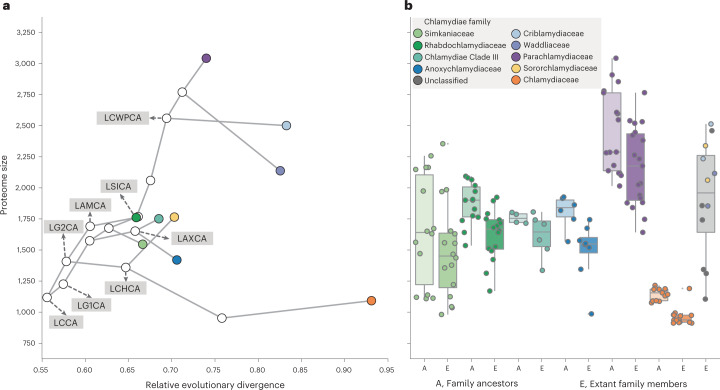
Fig. 5. The proteome size of Amoebachlamydiales ancestors increased relative to other chlamydiae.
a,b, Proteome size inferred for chlamydial ancestors, and protein-coding gene copies present in extant chlamydial genomes. a, Inferred proteome size of early chlamydial ancestors scaled to relative evolutionary divergence, from LCCA to extant taxa. b, Proteome size comparison between inferred ancestors and extant members within each chlamydial family. Chlamydiae without in-family ancestors are grouped together in the grey boxplot (that is, Criblamydiaceae, Waddliaceae, Sororchlamydiaceae and unclassified). Points and boxplots are coloured according to the legend. Centre lines in the box-and-whisker plot represent median values, box limits represent upper and lower quartile values and whiskers represent 1.5 times the interquartile range above the upper quartile and below the lower quartile. Number of ancestors and extant members per family depicted from left to right: n = 14, 16, 14, 16, 4, 6, 6, 8, 17, 19, 12, 14 and 12. Abbreviations of key ancestors are labelled as in Fig. 3. See also Supplementary Data 7 for proteome sizes.

