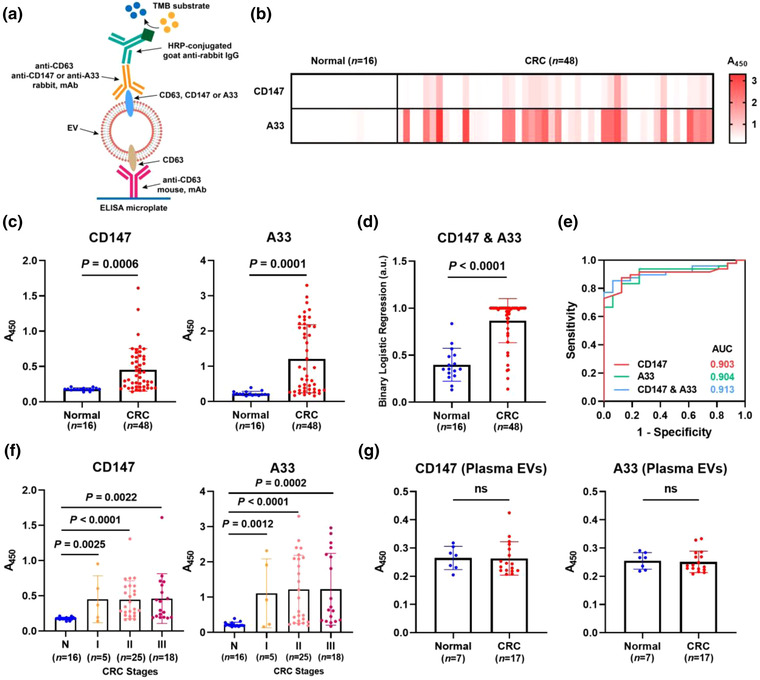
FIGURE 3.

Analysis of CD147 and A33 in EVs from clinical faeces specimens. (a) Schematic of ELISA system to detect proteins on fEVs. Heat map (b) and scatter diagrams (c) of the CD147 and A33 levels on fEVs collected from healthy donors (n = 16) and CRC patients (n = 48). (d) The levels of CD147 and A33 were combined into a single index scatter plot by binary logistic regression analysis (CD147 & A33). (e) ROC curves of CD147, A33, and CD147 & A33 to differentiate CRC patients from healthy donors. (f) Levels of CD147 and A33 on fEVs across CRC stages. (g) Levels of CD147 and A33 in plasma‐derived EVs collected from healthy donors and CRC patients.
