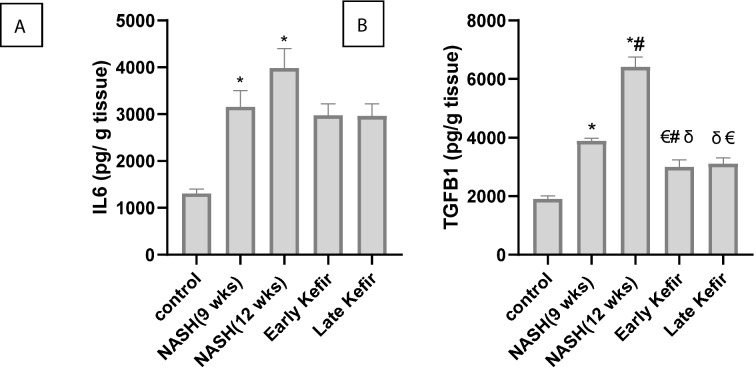
Figure 6.
The effect of Kefir treatment on (A) Level of IL-6 (B) Level of TGF-β1 in liver tissues from various groups. Values are mean ± SEM, number of animals = 8 rats/each group. *P < 0.001 compared to control group, #P < 0.001 compared to NASH (9 weeks) group, δP < 0.001 compared to NASH (12 weeks) group, €P < 0.05 compared to control group. One-way ANOVA followed by Tukey’s multiple comparison test. IL6 Interleukin 6, TGFB1 transforming growth factor beta 1.

