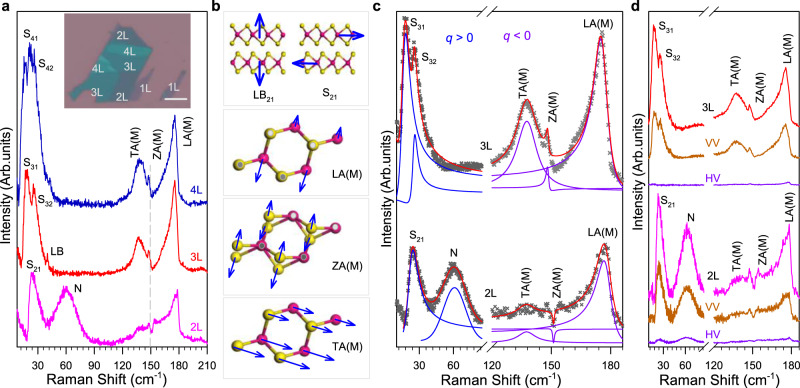
Fig. 2. Observation of quantum interference in few-layer WS2.
a Raman spectra of 2-4L WS2 at 4 K. Shear and layer breathing modes are labeled as Smi and LBmi, where m and i represent layer numbers and the ith modes, respectively46. N denotes a new peak. The inset shows the optical microscopy image of the few-layer WS2 sample (S1). The scale bar is 10 μm. b Illustration of the vibration of the layer breathing (LB21), shear (S21) modes of 2L-WS2 and TA(M), ZA(M), and LA(M) modes (see more detailed schematics in SI). c The fitting results of shear and zone-edged acoustic modes in 2L- and 3L-WS2. (d) Polarized Raman spectra of 2L- and 3L-WS2 at 4 K. The excitation wavelength is 612 nm (2.026 eV). V (H) denotes the vertical (horizontal) polarization. VV and HV indicate parallel and cross-polarization configuration, respectively. The data are offset for clarity.

