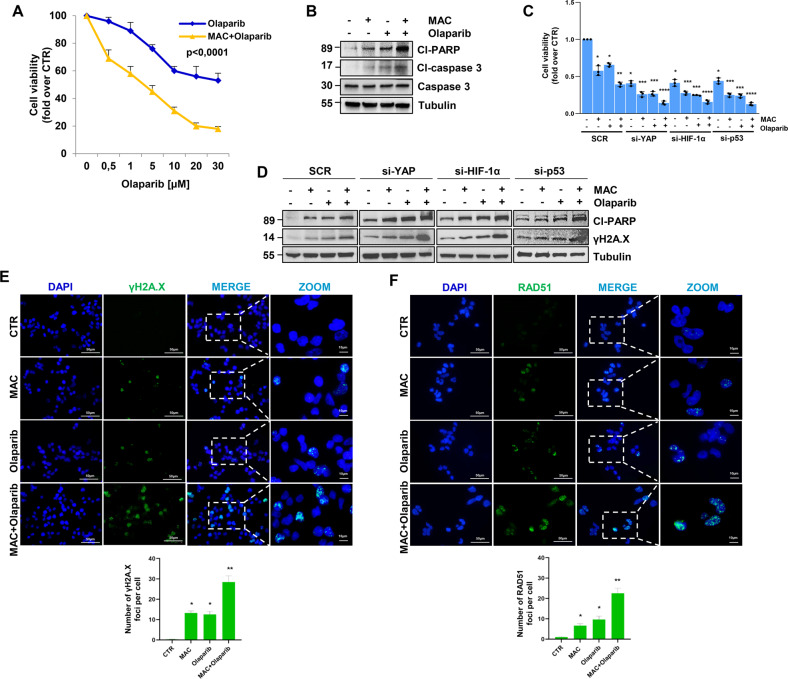
Fig. 6. ET-1R blockade by macitentan, hampering the mutp53/YAP/HIF-1α axis, enhances HG-SOC cell sensitivity to olaparib, promoting DNA damage and apoptosis.
A Effect of different concentrations of olaparib, alone or in combination with MAC (1 µM) for 48 h, on PMOV10 cell vitality. Data points are means ± SD (*p < 0.0001 vs. olaparib; n = 3). B IB analysis of cleaved-PARP (cl-PARP), caspase 3 and cleaved-caspase 3 (cl-caspase 3) expression in PMOV10 cells treated with MAC and/or olaparib (1 µM). Tubulin represents the loading control. C Effect of treatment with MAC and/or olaparib, alone or in combination for 48 h, on the vitality of PMOV10 cells transfected with SCR, si-YAP, si-HIF-1α or si-p53 for 72 h. Bars are the means ± SD (*p < 0.0005 vs. SCR CTR; **p < 0.002 vs. SCR olaparib; ***p < 0.002 vs. SCR olaparib or SCR MAC; ****p < 0.0006 vs. SCR MAC + olaparib; n = 3). D IB analysis of cleaved-PARP and phospho-Histone H2A.X (S139; γH2A.X) expression in PMOV10 cells treated as in C. Tubulin represents the loading control. Representative images of blots of 3 independent experiments are shown in B and D. E, F Representative images of γH2A.X (E) and RAD51 (F) foci (green) evaluated by IF in PMOV10 cells stimulated with MAC and/or olaparib for 24 h (scale bar: 50 µm, magnification 64X). Nuclei are stained blue (DAPI). Images are magnified to show the γH2A.X (E) and RAD51 (F) foci. The bottom graphs represent the quantification of the number of γH2A.X and RAD51 foci. Bars are means ± SD (*p < 0.005 vs. CTR; **p < 0.005 vs. olaparib; n = 3).

