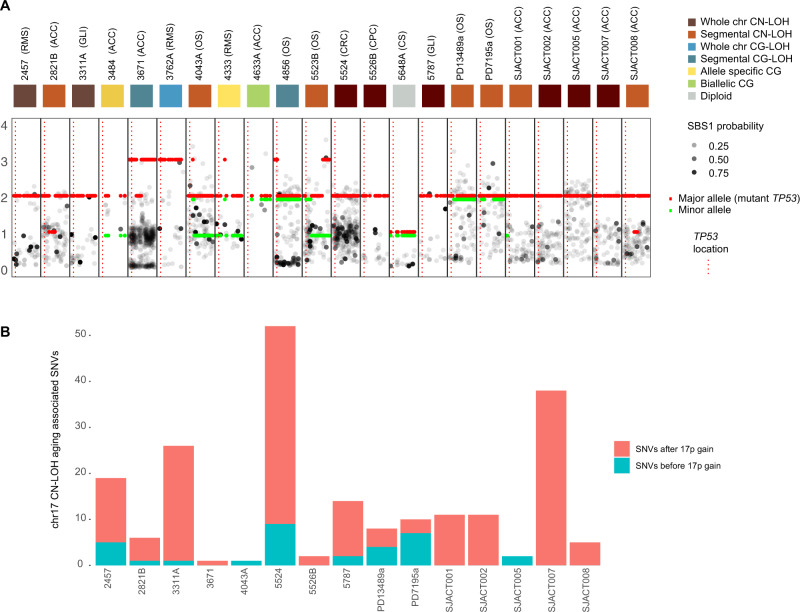
Fig. 3. TP53 LOH is an early event in the lifetime of LFS patients.
A Copy number of somatic individual mutations (black and gray points) on chromosome 17 across cohort of TP53-germline mutant tumors. Each black box represents chromosome 17 for one tumor. X-axis for each black box is the position on chromosome 17; Y-axis shows the copy number. Red and green bars are major and minor copy number. Gray points are colored by probability of contributing to SBS1 (clock-like signature). Colored squares at top represent CN state of TP53. CG copy gain. CN copy number. B Number of aging associated mutations (SBS1 or SBS5) occurring before (blue bar) and after (red bar) TP53 CN-LOH. X-axis depicts individual tumors. Y-axis depicts number of aging associated mutations. Source data are provided as a Source Data file.

