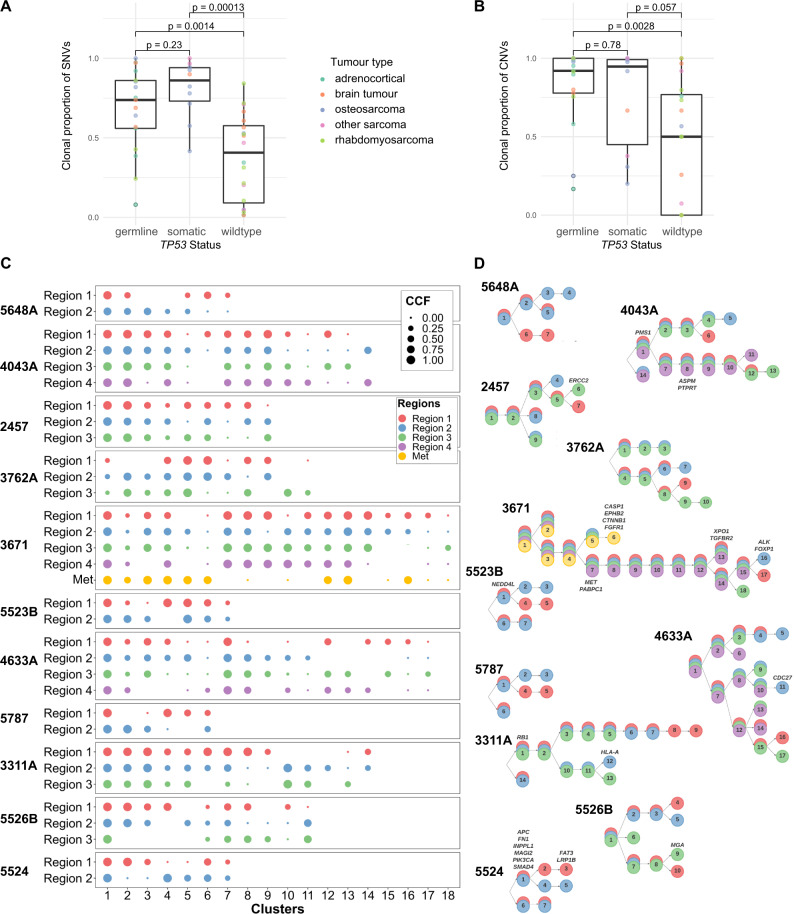
Fig. 5. TP53 mutant tumors have high proportion of clonal mutations.
A Boxplots showing proportion of SNVs per tumor (colored circles), which are clonal. Wilcoxon 2-tailed p-value shown. Colors indicate tumor type. Boxplots show quartiles with whiskers representing 1.5x interquartile range. N = 47 biologically independent samples from distinct patients. X-axis depicts TP53 status, Y-axis depicts proportion of SNVs which are clonal. B Boxplots showing proportion of CNVs per tumor (colored circles), which are clonal. Wilcoxon 2-tailed p-value shown. Boxplots show quartiles with whiskers representing 1.5x interquartile range. Colors indicate tumor type. -axis depicts TP53 status, Y-axis depicts proportion of CNVs which are clonal. C, D Phylogenetic reconstructions of LFS tumors using multiregion WGS (C) Circle plots, with subclonal cluster number on X-axis and tumor region on Y-axis. Circles are colored by tumor region. Circle diameter corresponds to cancer cell fraction (CCF) for each cluster for each tumor region. D Phylogenetic tree reconstructions of each multiregion sequenced tumor with colors corresponding to tumor region, numbers corresponding to cluster number and annotated with location of driver mutations. Source data are provided as a Source Data file.

