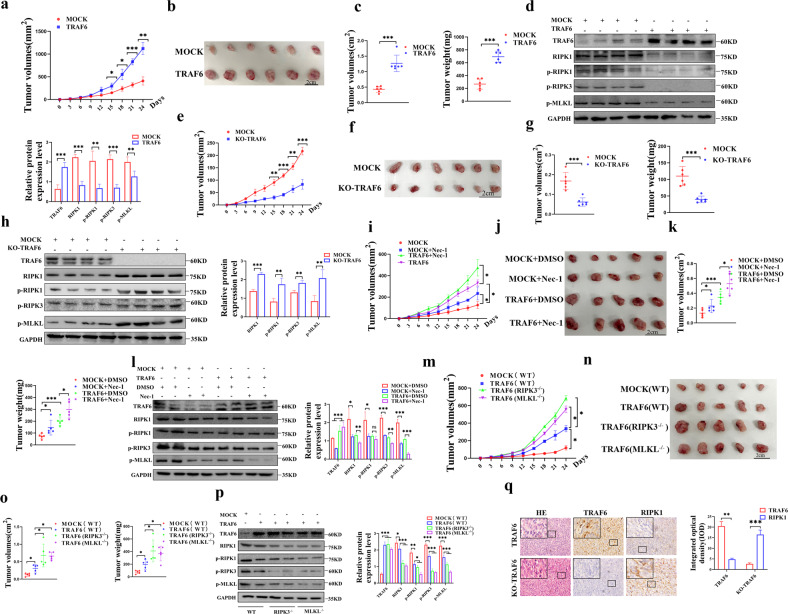
Fig. 8. Xenograft tumor model to demonstrate that TRAF6 inhibits RIPK1-RIPK3-MLKL signaling axis in colorectal cancer cells.
a–d A subcutaneous tumor model of BALB/c female nude mice with high protein levels of TRAF6 cells was established. Tumors were measured every 3 days (a). The images show the tumors formed by the mice from the overexpression of TRAF6 in HCT116 cells compared to control tumors group (b). The volume and weight of the tumor tissue were statistically analyzed (c). Protein expression levels of the RIPK1-RIPK3-MLKL signaling axis were detected in western blotting (d). e–h BALB/c female nude mice were subcutaneously transplanted with CRISPR/Cas9 gene knockout TRAF6 cells. Tumors were measured every 3 days (e). The images show the tumors formed by the mice from the KO-TRAF6 in HCT116 cells and control cells (f). Tumor volume and weight (g) were statistically analyzed. Protein expression levels of the RIPK1-RIPK3-MLKL signaling axis were detected in western blotting (h). i–l A subcutaneous tumor model of BALB/c female nude mice with high expression of TRAF6 in HCT116 cells treated with Nec-1, tumors were measured every 3 days (i). The images show the tumors formed by mice in each group of MOCK + DMSO, MOCK + Nec-1, TRAF6 + DMSO, and TRAF6 + Nec-1 (j). The volume and weight of tumor tissue were statistically analyzed (k). Protein expression levels of the RIPK1-RIPK3-MLKL signaling axis were detected in western blotting (l). m–p To construct a subcutaneous high expression TRAF6 cell transplantation tumor model with RIPK3−/− or MLKL−/− C57BL/6 genetic background, and tumor was measured every 3 days (m). The images show the tumors (n) isolated from mice in each group of MOCK (WT), TRAF6 (WT), TRAF6 (RIPK3−/−), and TRAF6 (MLKL−/−). The volume and weight (o) of tumor tissue were analyzed statistically. Protein expression levels of the RIPK1-RIPK3-MLKL signaling axis were detected in western blotting (p). q HE staining and immunohistochemical staining was performed on serial paraffin sections of xenografts of TRAF6-overexpressing TRAF6 cell xenografts and CRISPR/Cas9 knockout TRAF6 xenografts, showing the tissue structure of xenografts, as well as the protein expression of TRAF6 and RIPK1 level. Pictures were captured with an inverted microscope (×400). integrated optical density (IOD) detection was performed on the immunohistochemical results, and the bars represent integrated optical density (IOD) ± standard deviation (SD). (*p < 0.05, **p < 0.01, ***p < 0.001, with an unpaired Student’s t test (a–h, q) or one-way ANOVA analysis (i–p)).

