Fig. 3.

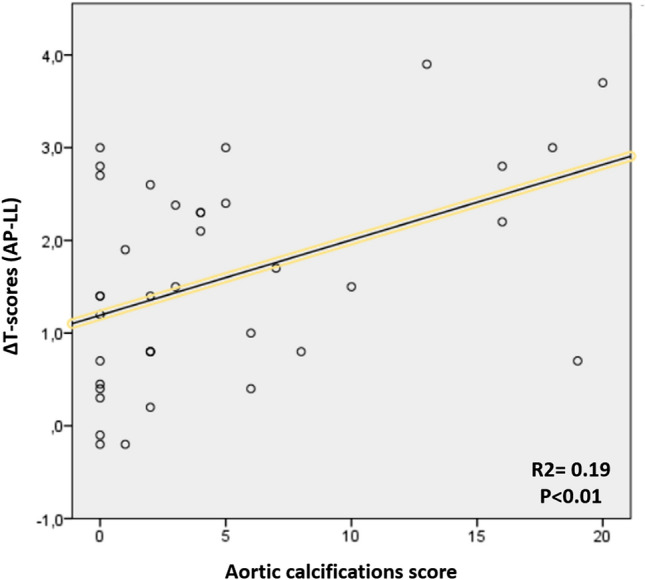
Scatter plot reporting the relationship between the difference between the AP and LL T-scores (∆ T-scores AP-LL; y-axis) and the aortic calcifications score (x-axis). Significance and R2 refer to the Pearson’s correlation

Scatter plot reporting the relationship between the difference between the AP and LL T-scores (∆ T-scores AP-LL; y-axis) and the aortic calcifications score (x-axis). Significance and R2 refer to the Pearson’s correlation