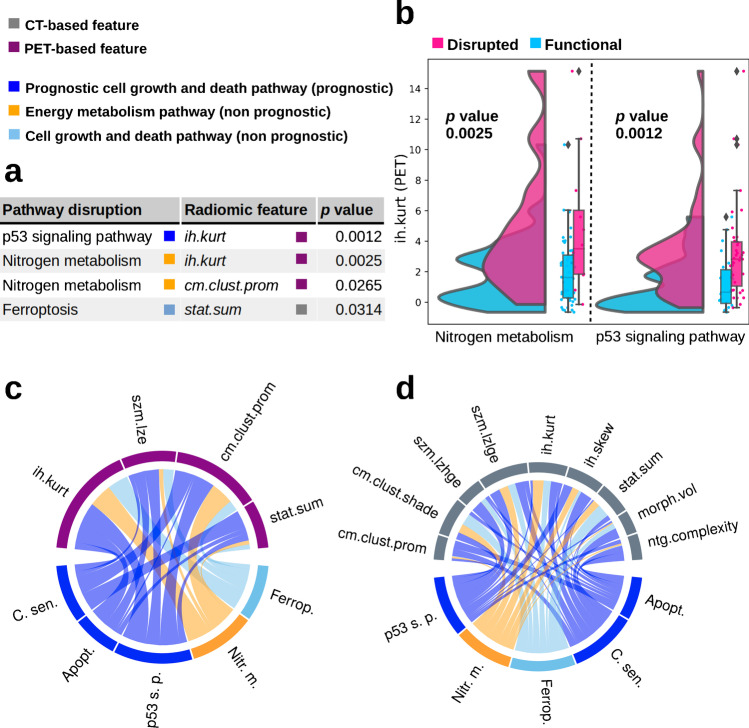
Fig. 4.
Association of PET- and CT-based radiomic features with pathways related to cell growth and death as well as energy metabolism. a Pathways and linked radiomic features with p values below 0.05. b Distribution of the two most significant associations: PET-based radiomic histogram feature excess discretized intensity kurtosis (ih.kurt) depending on the functional state of two pathways, nitrogen metabolism (left) and p53 signaling (right). For each pathway, the distribution of the radiomic feature ih.kurt (PET) is visualized for patients with functional (blue) and disrupted (pink) genetic status via kernel density estimation. A higher width of the curve area at a given radiomic feature value on the y-axis indicates a higher probability of a patient to have the respective radiomic feature value as estimated by the kernel density estimation. Furthermore, for each pathway, two boxplots indicate the distribution of the radiomic feature for patients with functional and disrupted genetic status. Radiomic features are displayed in arbitrary units. c Associations between PET radiomic features and pathways. d Associations between CT radiomic features and pathways. The width of the links indicates the inverse p value within each of the chord plots. Pathways include cellular senescence (C. sen.), apoptosis (Apopt.), p53 signaling pathway (p53 s. p.), nitrogen metabolism (Nitr. m.), and ferroptosis (Ferrop.)

