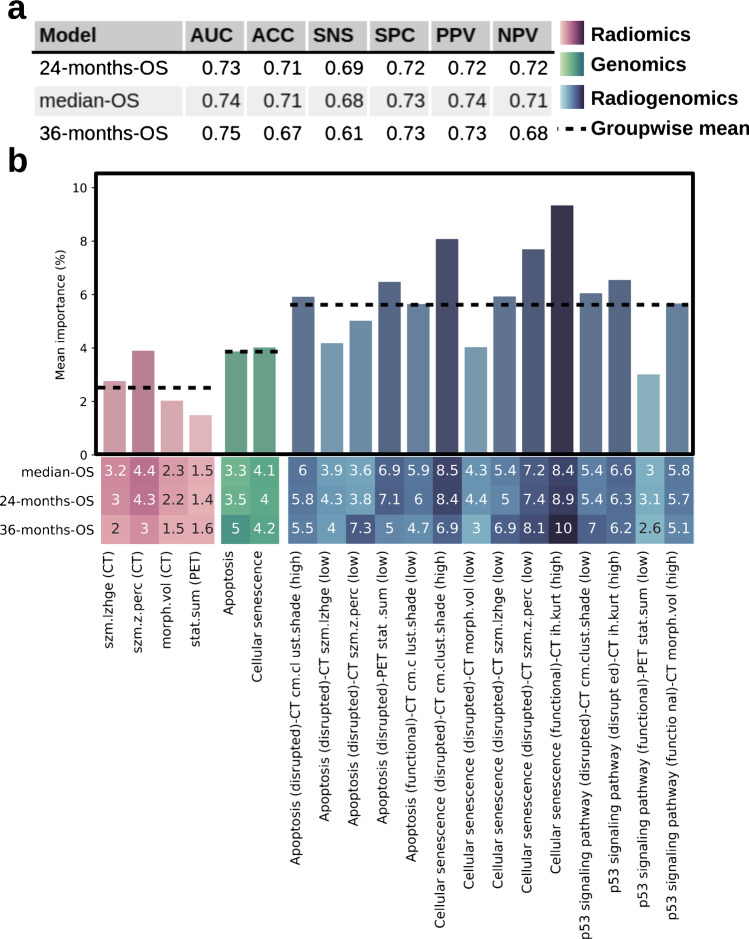
Fig. 6.
Machine learning–derived feature ranking (% importance) for the three classification models. a Performance metrics for the classification models include area under the receiver operating characteristic curve (AUC), accuracy (ACC), sensitivity (SNS), specificity (SPC), positive predictive value (PPV), and negative predictive value (NPV). b The heatmap shows the feature contribution for each model. The bar chart shows the importance of each feature as mean over the models. Darker colors indicate higher values. The dashed lines indicate the mean importance over all features belonging to one of the three feature categories, radiomics, genomics, and radiogenomics. Feature importance was calculated based on R-squared ranking

