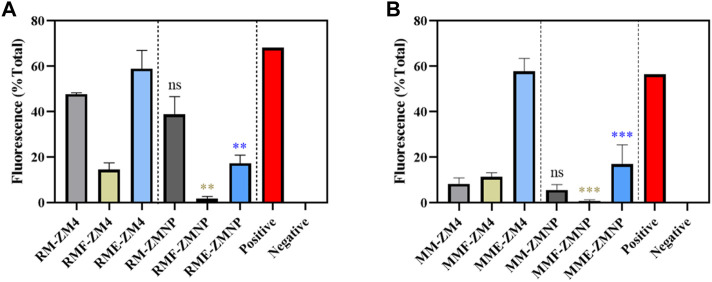
FIGURE 6.
The ROS accumulation of ZM4 and ZMNP responding to different inhibitors. (A) ROS accumulation detection under RM with or without inhibitors. (B) ROS accumulation detection under MM with or without inhibitors. Data presented in the graphs are the mean ± SD of three replications. T-test analysis was conducted for ROS detection with RM/MM-ZM4 (black asterisk), RMF/MMF-ZM4 (green asterisk) or RME/MME (blue asterisk) condition as the control. ns represents no significant difference (p-value > 0.05), * represents a significant difference (0.01< p-value < 0.05), ** represents a significant difference (0.001 < p-value < 0.01), *** represents a significant difference (p-value < 0.001).

