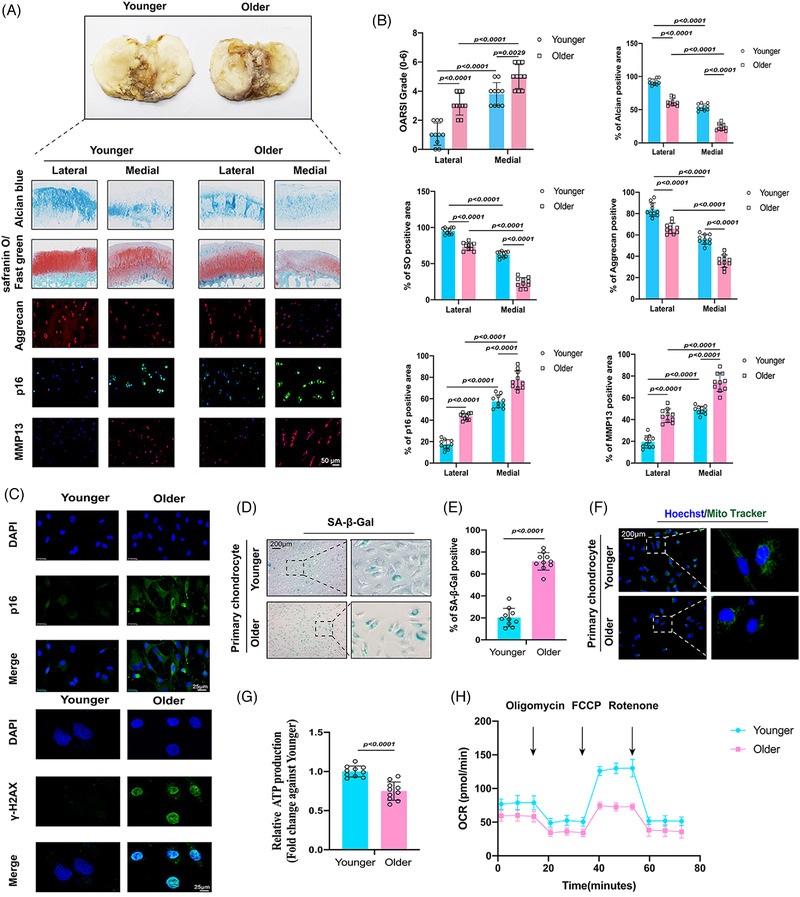
FIGURE 1.

Validation of senescent phenotypes in the older human cohort: (A) representative images of Safranin‐O/Fast green staining, Alcian blue staining and immunofluorescence of aggrecan, p16 and MMP13 between younger group (45–55‐year old) and older group (75–85‐year old); (B) quantifications of Osteoarthritis Research Society International (OARSI) grades, aggrecan positive staining, SO‐positive staining, Alcian blue–positive staining, MMP13 positive staining and p16 positive staining; (C) representative immunofluorescence images of p16 and γ‐H2AX in younger and older chondrocytes; (D) senescence β‐galactosidase (SA‐β‐Gal) staining in younger and older chondrocytes; (E) quantification of SA‐β‐Gal staining in younger and older chondrocytes; (F) MitoTracker staining in younger and older chondrocytes; (G) quantification of adenosine triphosphate (ATP) production in younger and older chondrocytes; (H) oxygen consumption rate (OCR), which reflects mitochondrial respiration, was decreased in older chondrocytes; quantitative data shown as mean ± SD; exact p‐values are shown in figures. Two‐side unpaired Student's t‐test was used for statistical analysis. One‐way ANOVA with Tukey's multiple comparison was used for statistical analysis.
