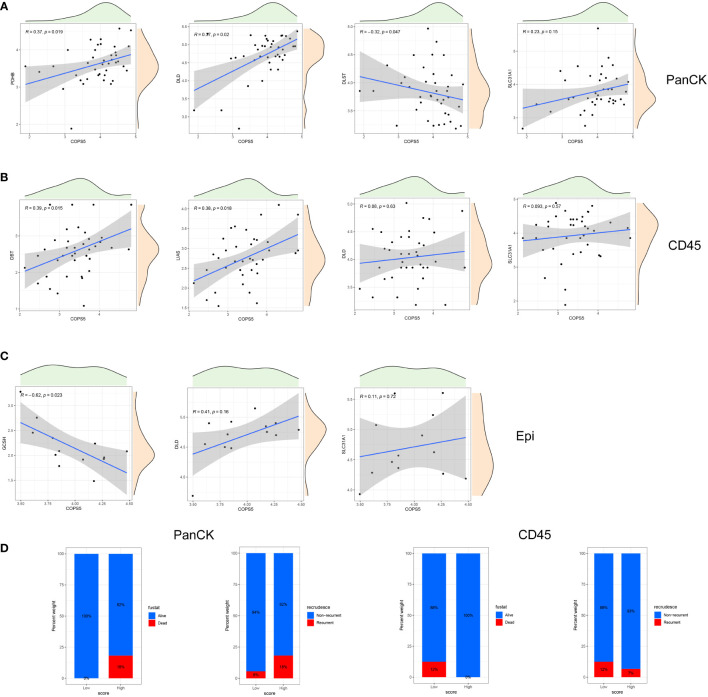
Figure 4.
Correlation of cuproptosis related genes and Jab1 in different regions. (A) A correlation scatter plot: Jab1 correlates with the expression of cuproptosis related genes in tumor cell-enriched region. (B) A correlation scatter plot: Jab1 correlates with the expression of cuproptosis related genes in immune cell-enriched region. (C) A correlation scatter plot: Jab1 correlates with the expression of cuproptosis related genes in normal epithelial region. (D) NPC patient status distribution (PCA group) in tumor cell-enriched region and immune cell-enriched region.

