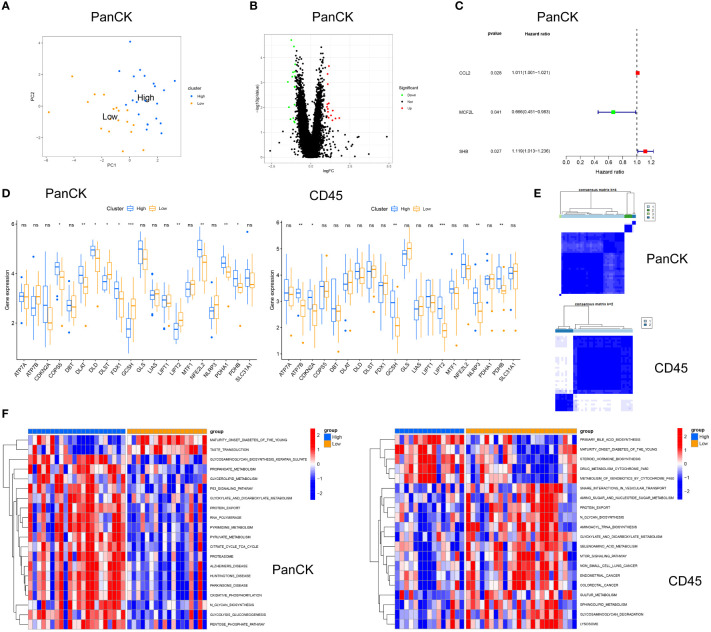
Figure 5.
Cuproptosis related genes for stratification in tumor cell-enriched region and immune cell-enriched regions. (A) Principal Component Analysis in tumor cell-enriched region. (B) Differential analysis in Tumor cell-enriched region, green for downregulation, red for upregulation, log|FC|>1 and P<0.05. (C) Univariate Cox analysis in tumor cell-enriched region. (D) Differential expression of cuproptosis related genes and Jab1 between high and low score groups. (E) Typing in Tumor cell-enriched region: four clusters. Typing in immune cell-enriched region: two clusters (F) GSVA for high and low score groups in tumor cell-enriched regions and immune cell-enriched regions. *p<0.05, **p<0.01, ***p<0.001, ns, not significant.

