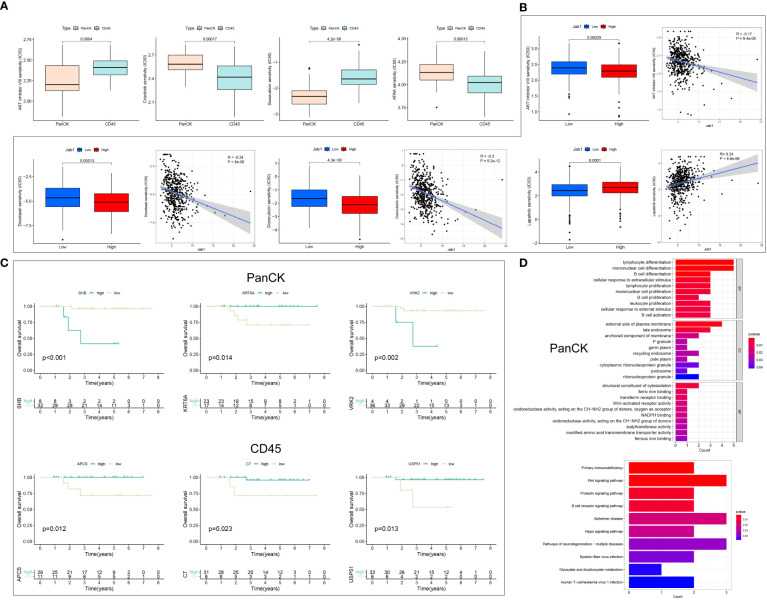
Figure 6.
Drug sensitivity analysis and the role of Jab1 in different regions of NPC. (A) Differences in IC50 of drugs in NPC patients in tumor cell enriched regions and immune cell enriched regions. (B) Jab1 expression affects the IC50 of drug-treated HNSCC patients. (C) Differential genes from the Jab1 high and low expression groups for survival analysis in tumor cell enriched regions and immune cell enriched regions. (D) Differential genes from the Jab1 high and low expression groups for functional enrichment analysis (GO and KEGG) in tumor cell enriched regions.

