Figure 7.
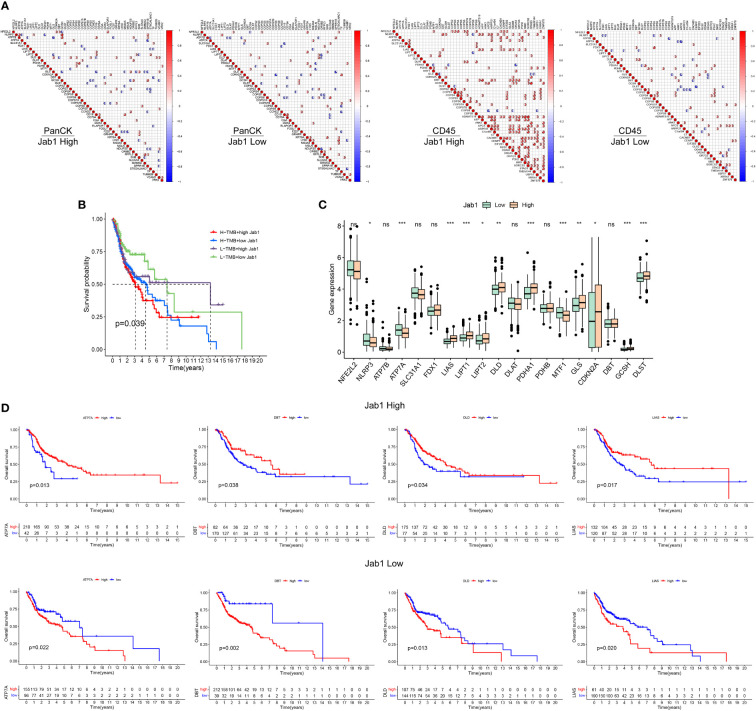
Differential analysis of cuproptosis related genes between the high and low Jab1 groups. (A) Correlation analysis of cuproptosis related genes, COPS family genes, and differential genes from the high and low Jab1 groups in different regions (tumor cell-enriched region and immune cell-enriched region) and different Jab1 subgroups: red (positive correlation), blue (negative correlation), sector direction (clockwise for positive correlation, and counterclockwise for negative correlation), only the sector area at p < 0.05 is shown. The darker the colors, the larger the sector areas, and the higher the correlations. (B) TMB and Jab1 affect survival of HNSCC patients. (C) Differential analysis of cuproptosis related genes between the high and low Jab1 groups. (D) Cuproptosis related genes and Jab1 affect the survival of HNSCC patients. *p<0.05, **p<0.01, ***p<0.001, ns, not significant.

