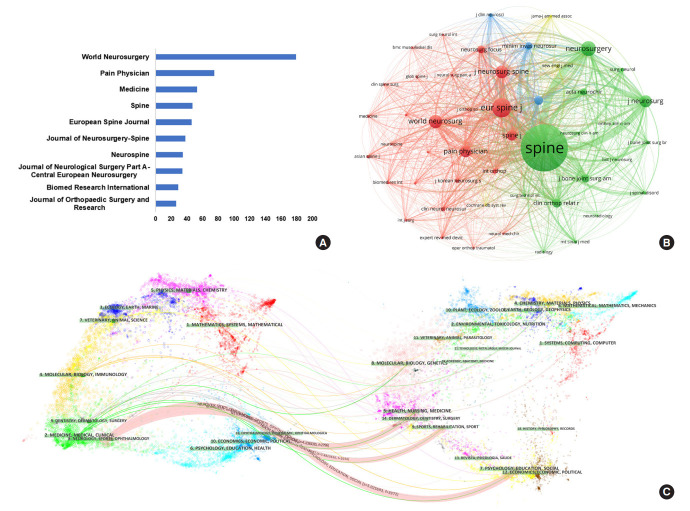
Fig. 5.
(A) The top 10 journals with the greatest number of publications. (B) The network visualization map of journal cocitation analysis using VOSviewer. The size of the node represents the citation frequency, and the line between 2 nodes means that both were cited by 1 journal. (C) A dual-map overlay of journals on endoscopic discectomy research was generated by CiteSpace. The labels represent different disciplines covered by the journals. The citing journals are on the left half, the cited journals are on the right half, and the colored path represents the citation relationship.

