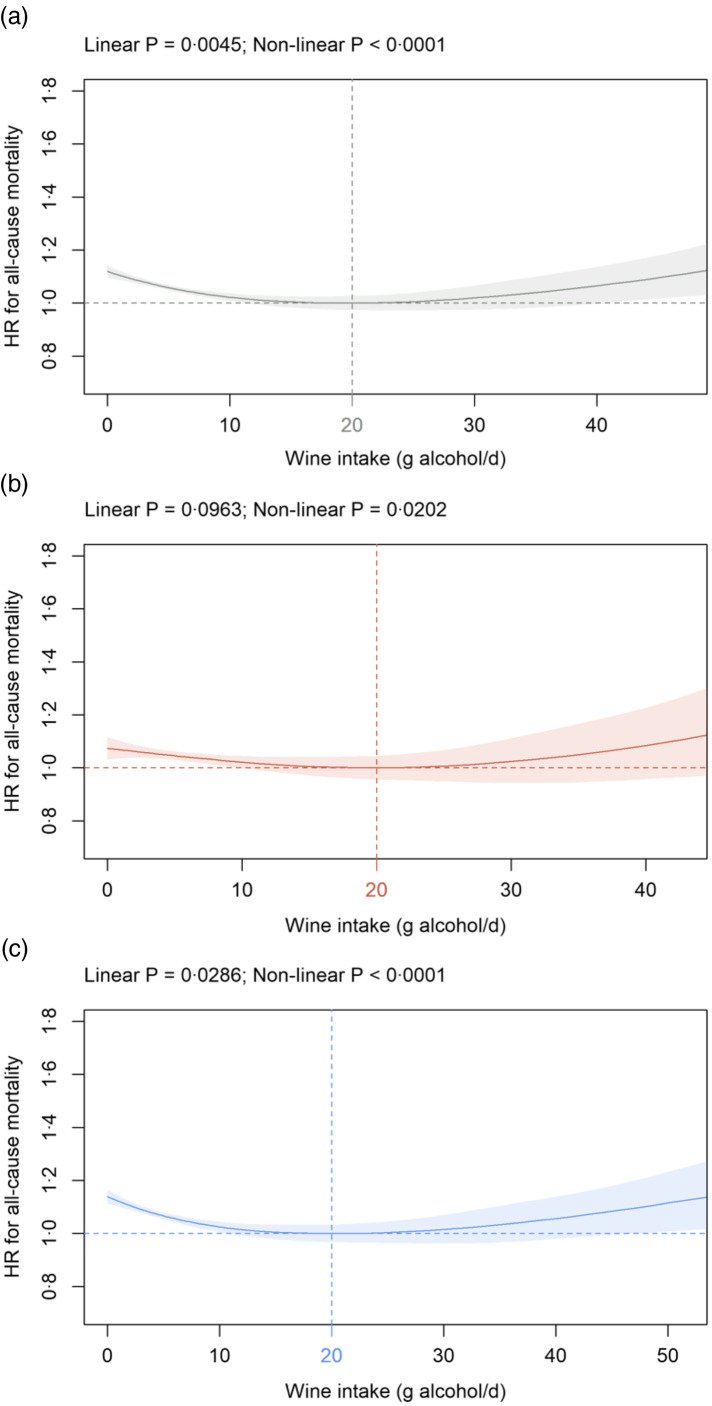
Fig. 1.
Association of wine intake (g alcohol/d) in: (a) all participants; (b) females and (c) males with all-cause mortality in the primary cohort. Data are adjusted for sex (all participants only), age, AHI, ethnicity, OHR, PA, percentage body fat and smoking status. Additionally, wine, non-wine, coffee and tea intake are mutually adjusted (e.g. wine intake is additionally adjusted for non-wine, coffee and tea intake) as summarised in the Methods section. Covariates not fulfilling the proportional hazard assumption (all participants: age; females: age; males: age, OHR, percentage body fat) are stratified. The nadir is indicated in grey (total cohort), red (female) and blue (male). HR: hazard ratio; AHI, annual household income; OHR, overall health rating; PA, physical activity.

