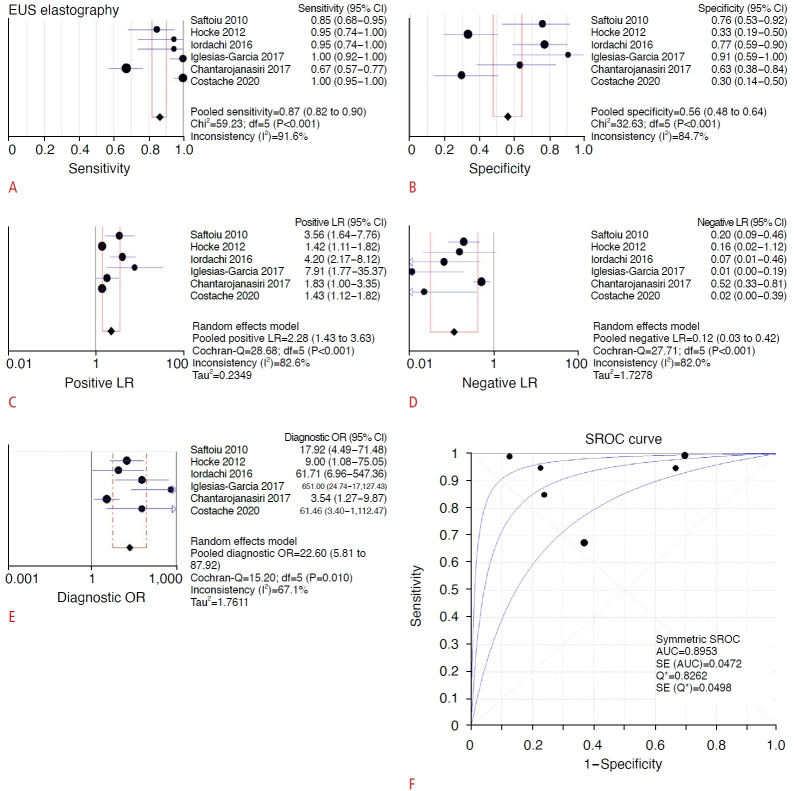
Fig. 2.
Forest plots of the meta-analysis of sensitivity (A), specificity (B), LR+ (C), LR- (D), and diagnostic OR (E), as well as the SROC curve (F) for the differentiation of pancreatic adenocarcinomas with EUS elastography only [22-27]. AUC, area under the curve; CI, confidence interval; EUS, endoscopic ultrasonography; LR+, positive likelihood ratio; LR-, negative likelihood ratio; OR, odds ratio; SROC, summary receiver operating characteristic.

