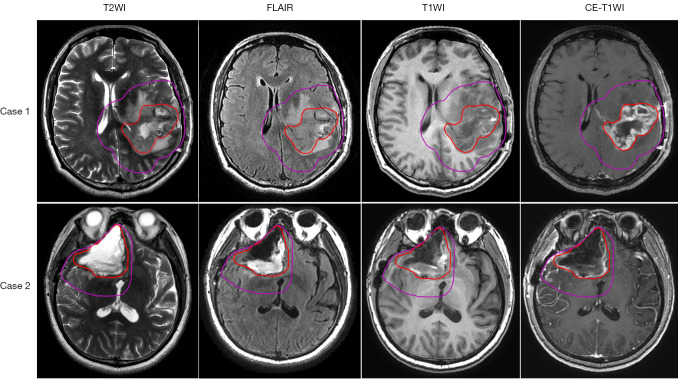
Figure 1.
Examples for GTV and CTV. GTV is contoured in red, and CTV is contoured in purple. Each row represents MRI images for 1 patient; from left to right: T2WI, FLAIR, T1WI, and CE-T1WI. T2WI, T2-weighted imaging; FLAIR, fluid-attenuated inversion recovery; T1WI, T1-weighted imaging; CE-T1WI, contrast-enhanced T1-weighted imaging; GTV, gross tumor volume; CTV, clinical target volume; MRI, magnetic resonance imaging.

