
Fig. 5.
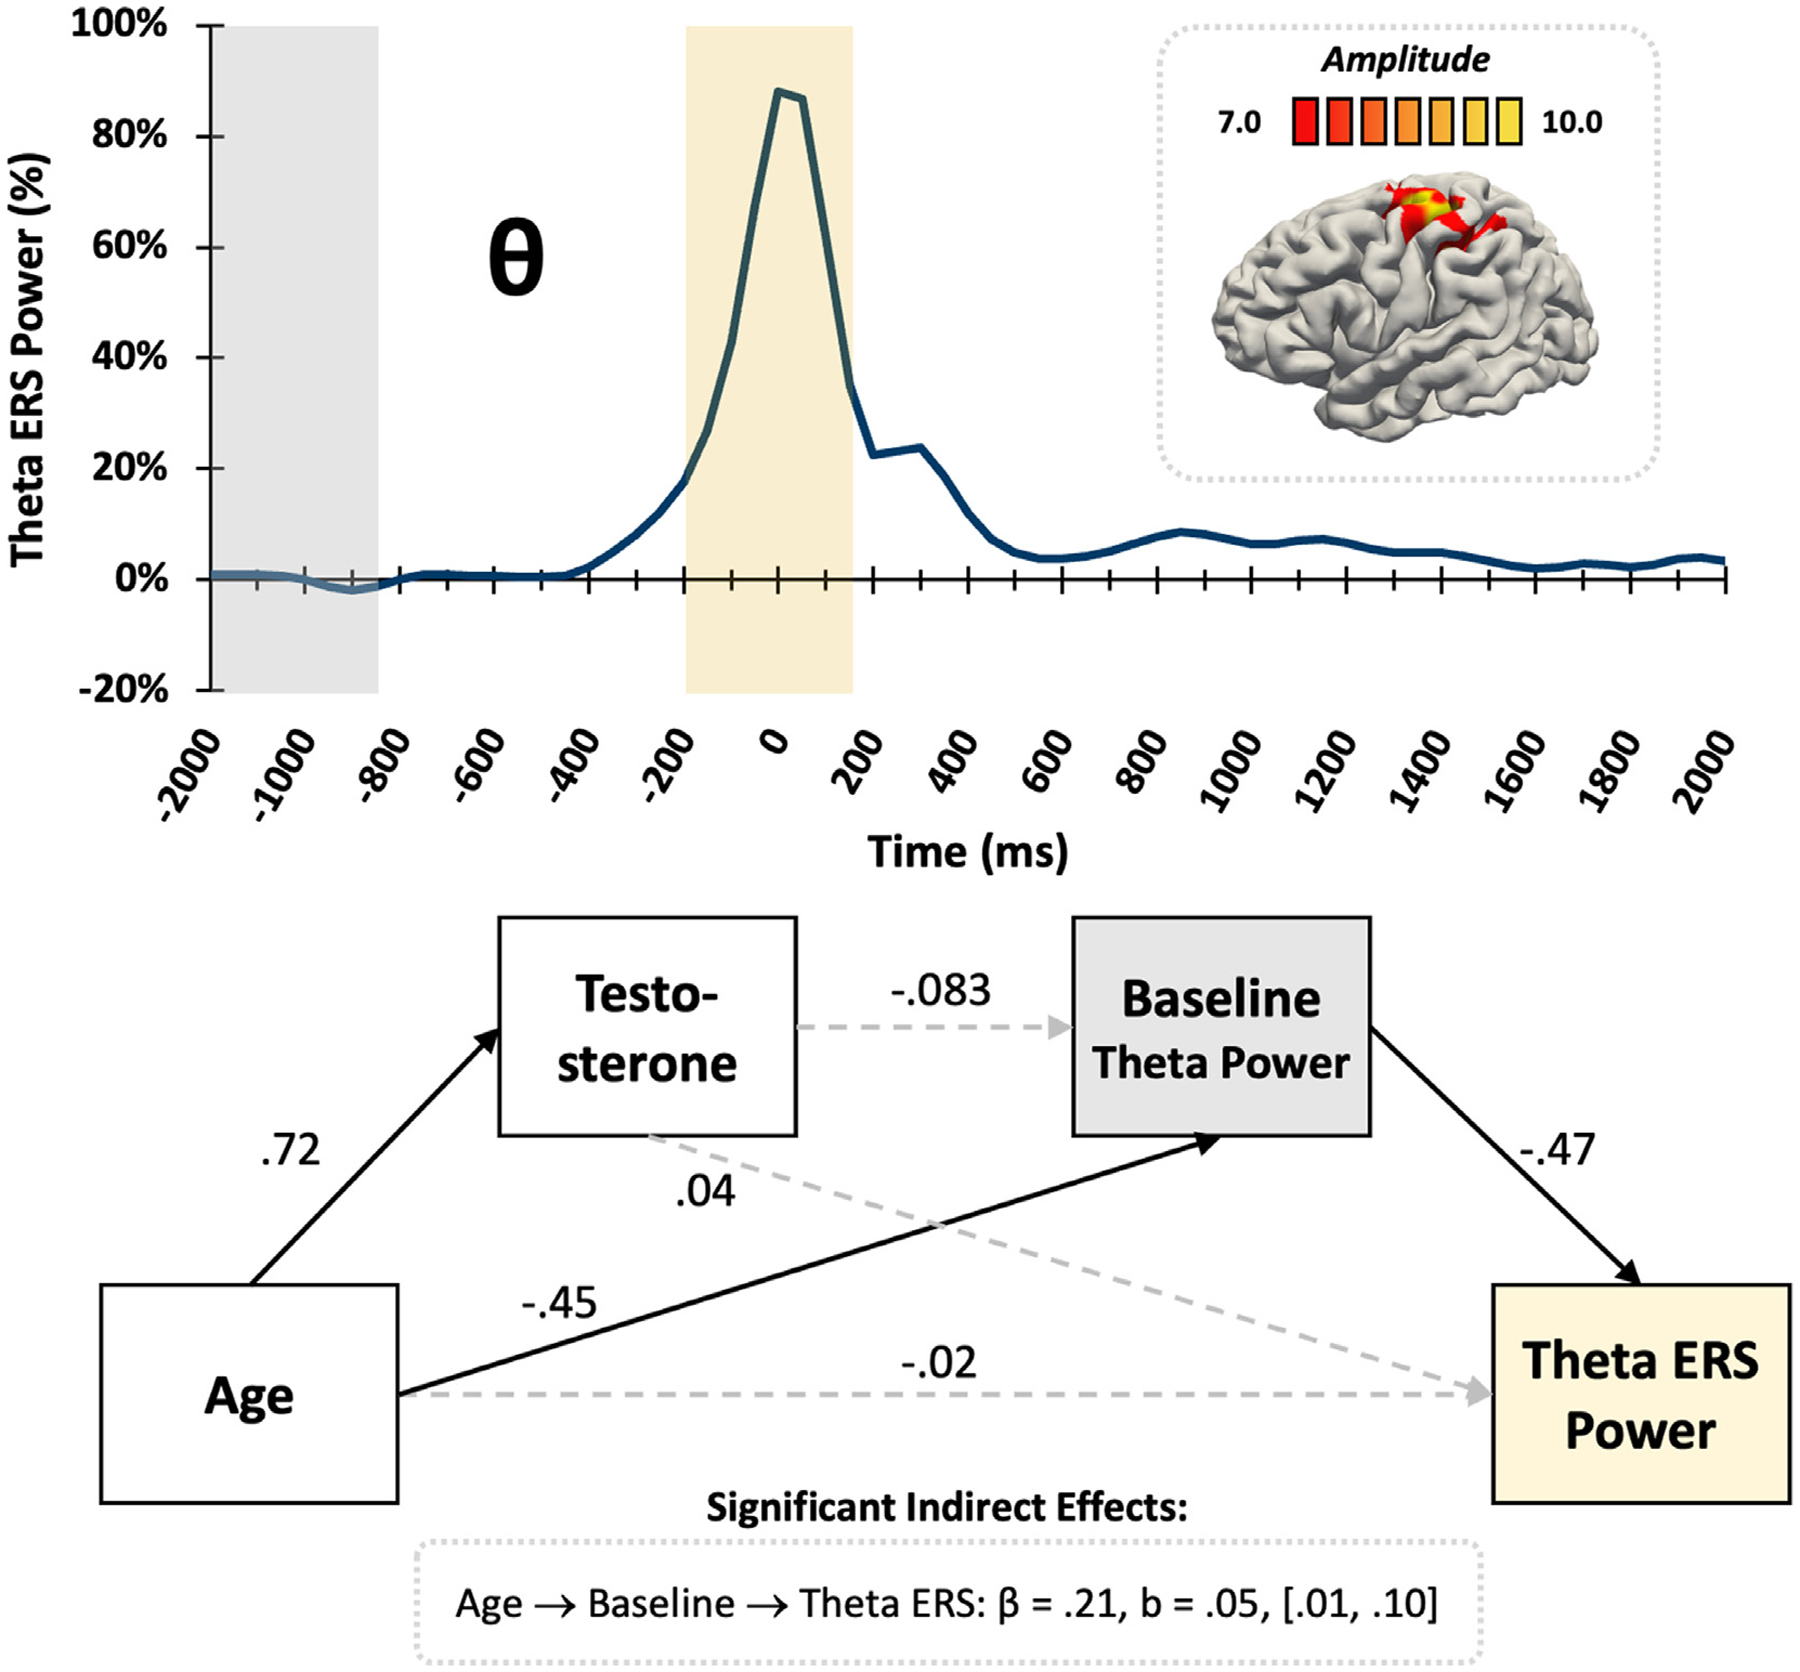
Motor-related theta ERS. (Top) The average brain map shows the theta ERS was strongest in the left motor cortex, with the color scale bar in pseudo-t units directly above. The theta time series envelope (3–6 Hz) extracted from the peak voxel shows a significant increase in theta power (i.e., ERS; yellow box) around movement onset relative to the baseline period (grey box). (Bottom) The statistical diagram demonstrates the partial mediation of theta response metrics, with standardized coefficients shown. Solid lines signify statistically significant relationships at p < .05, dotted lines represent nonsignificant relationships. The indirect effect of age through spontaneous theta power during the baseline significantly predicted the strength of the theta ERS response.