. 2022 Nov 7;4(1):78–97. doi: 10.1158/2643-3230.BCD-22-0007

Figure 2.

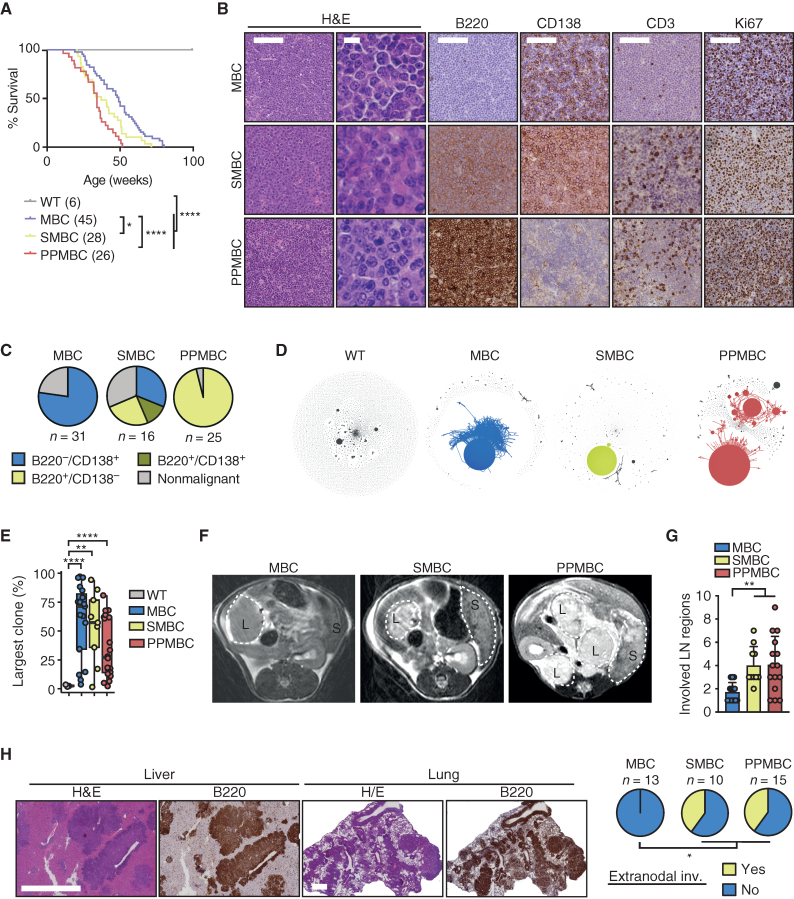
Figure 2. PPMBC and SMBC animals develop ABC-DLBCL–like tumors. A, Survival curves of wild-type (n = 6), MBC (n = 45, median 49 weeks), SMBC (n = 28, median 37.1 weeks), and PPMBC animals (n = 26, median 34.1 weeks). B, Representative H&E and IHC stainings of MBC, SMBC, and PPMBC tumors. Scale bars represent 100 μm (low magnification) and 10 μm (high magnification H&E). C, Quantification of the terminal phenotype of MBC, SMBC, and PPMBC animals shown in B. D, Clonality plots generated from BCR sequencing data. Each circle represents a specific V(D)J sequence with the circle size being proportional to the respective read count. Sequences with one mismatch are connected to clones. Clones with a size > 10% of reads are colorized, smaller clusters are in gray. E, Maximum clone sizes in MBC (n = 18), SMBC (n = 9), and PPMBC (n = 18) lesions compared with the polyclonal scenario observed in wild-type spleens (n = 3). F, Representative axial MR images of preterminal MBC (n = 16), SMBC (n = 8), and PPMBC (n = 12) animals. Lymphomas and spleens are outlined (“L” and “S,” respectively). G, Quantification of the number of lymph node regions infiltrated by lymphoma of moribund MBC (n = 14), SMBC (n = 10) and PPMBC (n = 15) animals at necropsy. H, Representative H&E and B220 stainings of infiltrated liver and lungs of terminal PPMBC animals and quantification of animals with observed extranodal manifestation. Scale bars represent 500 μm. *, P ≤ 0.05; **, P ≤ 0.01; ***, P ≤ 0.001; Welch unpaired two-tailed t test; error bars represent SD.

PPMBC and SMBC animals develop ABC-DLBCL–like tumors. A, Survival curves of wild-type (n = 6), MBC (n = 45, median 49 weeks), SMBC (n = 28, median 37.1 weeks), and PPMBC animals (n = 26, median 34.1 weeks). B, Representative H&E and IHC stainings of MBC, SMBC, and PPMBC tumors. Scale bars represent 100 μm (low magnification) and 10 μm (high magnification H&E). C, Quantification of the terminal phenotype of MBC, SMBC, and PPMBC animals shown in B. D, Clonality plots generated from BCR sequencing data. Each circle represents a specific V(D)J sequence with the circle size being proportional to the respective read count. Sequences with one mismatch are connected to clones. Clones with a size > 10% of reads are colorized, smaller clusters are in gray. E, Maximum clone sizes in MBC (n = 18), SMBC (n = 9), and PPMBC (n = 18) lesions compared with the polyclonal scenario observed in wild-type spleens (n = 3). F, Representative axial MR images of preterminal MBC (n = 16), SMBC (n = 8), and PPMBC (n = 12) animals. Lymphomas and spleens are outlined (“L” and “S,” respectively). G, Quantification of the number of lymph node regions infiltrated by lymphoma of moribund MBC (n = 14), SMBC (n = 10) and PPMBC (n = 15) animals at necropsy. H, Representative H&E and B220 stainings of infiltrated liver and lungs of terminal PPMBC animals and quantification of animals with observed extranodal manifestation. Scale bars represent 500 μm. *, P ≤ 0.05; **, P ≤ 0.01; ***, P ≤ 0.001; Welch unpaired two-tailed t test; error bars represent SD.