. 2022 Nov 7;4(1):78–97. doi: 10.1158/2643-3230.BCD-22-0007

Figure 3.

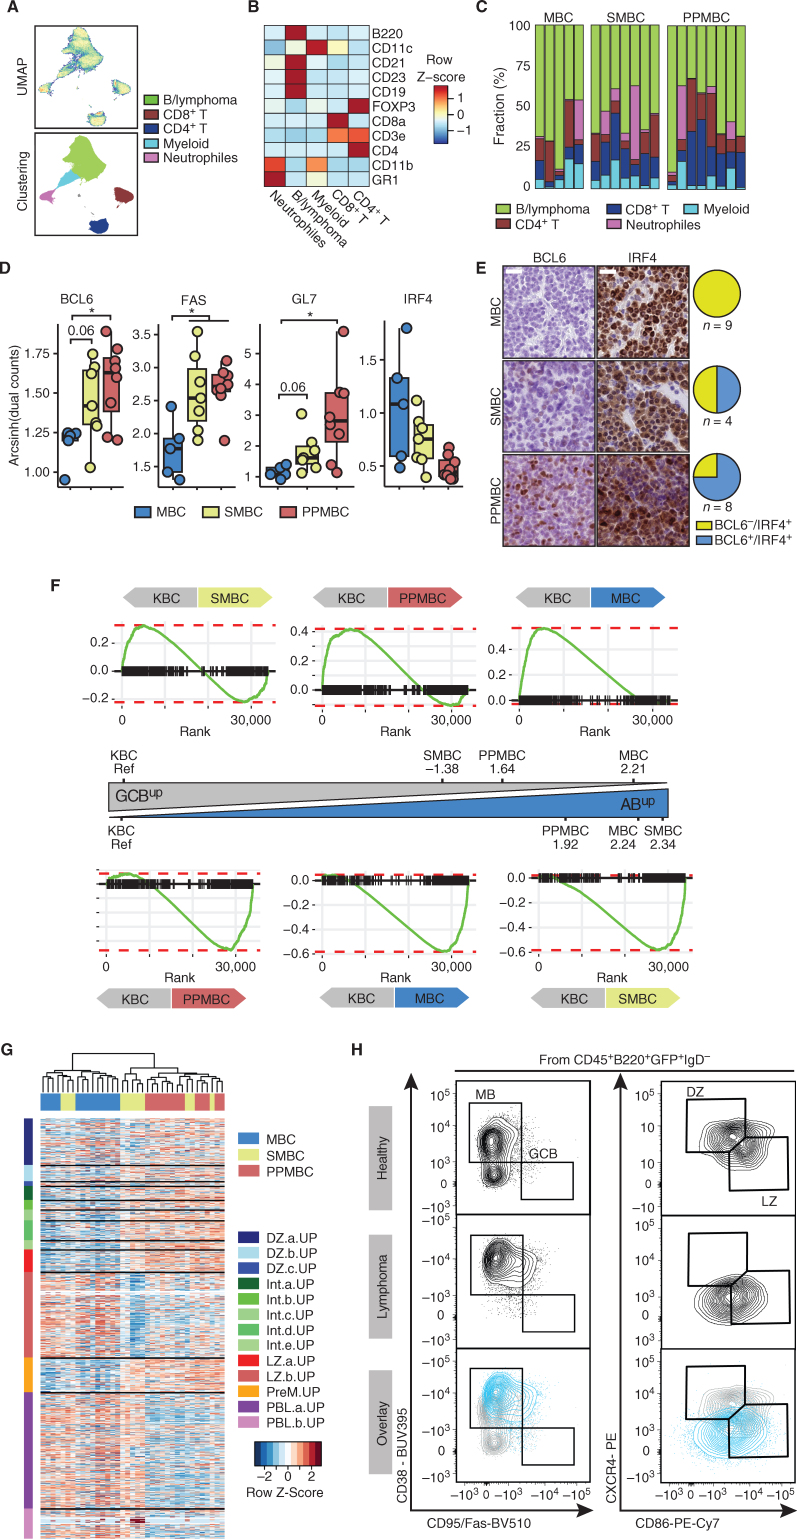
Figure 3. PPMBC and SMBC lymphomas display transcriptomic and surface marker features associated with germinal center–derived lymphomas. A, Cell suspensions from MBC (n = 5), SMBC (n = 7), and PPMBC (n = 8) tumors were analyzed by mass cytometry. Dimensionality reduction of the data set was performed by UMAP and clusters were gated manually. B, Heat map of lineage markers used for cluster identification. C, Cluster sizes observed in MBC, SMBC, and PPMBC samples. D, Expression of BCL6, FAS, GL7, and IRF4 in the “B/lymphoma” cluster. E, Representative images (left) and quantification (right) of IHC BCL6 and IRF4 stainings in MBC, SMBC, and PPMBC lymphomas. Scale bar represents 20 μm. F, Gene set enrichment plots comparing the transcriptional profiles of MBC (n = 13), SMBC (n = 11), and PPMBC (n = 13) lymphomas to the KBC model (n = 6) as reference. The NES is illustrated as an approximation of the distance between the genotypes. G, Bulk transcription profiles of MBC, SMBC, and PPMBC lymphomas were clustered in an unsupervised manner by their expression levels of published gene sets derived from single-cell transcriptomic analyses of human GC B cells (26). DZ, dark zone; Int, intermediate; LZ, light zone; PreM, pre-memory B; PBL, plasmablast. H, Representative flow cytometry plots and gating strategy of splenic MB, GCB, and DZ/LZ B cells from a 10-week-old healthy C mouse (top) and lymphoma cells from a PPMBC lesion (middle). Bottom, an overlay of both samples. A total of 10 PPMBC lymphomas was analyzed; additional samples are illustrated in Supplementary Fig. S8, full gating strategy is depicted in Supplementary Fig. S12A; H–I, *, P ≤ 0.05, Welch unpaired two-tailed t test.

PPMBC and SMBC lymphomas display transcriptomic and surface marker features associated with germinal center–derived lymphomas. A, Cell suspensions from MBC (n = 5), SMBC (n = 7), and PPMBC (n = 8) tumors were analyzed by mass cytometry. Dimensionality reduction of the data set was performed by UMAP and clusters were gated manually. B, Heat map of lineage markers used for cluster identification. C, Cluster sizes observed in MBC, SMBC, and PPMBC samples. D, Expression of BCL6, FAS, GL7, and IRF4 in the “B/lymphoma” cluster. E, Representative images (left) and quantification (right) of IHC BCL6 and IRF4 stainings in MBC, SMBC, and PPMBC lymphomas. Scale bar represents 20 μm. F, Gene set enrichment plots comparing the transcriptional profiles of MBC (n = 13), SMBC (n = 11), and PPMBC (n = 13) lymphomas to the KBC model (n = 6) as reference. The NES is illustrated as an approximation of the distance between the genotypes. G, Bulk transcription profiles of MBC, SMBC, and PPMBC lymphomas were clustered in an unsupervised manner by their expression levels of published gene sets derived from single-cell transcriptomic analyses of human GC B cells (26). DZ, dark zone; Int, intermediate; LZ, light zone; PreM, prememory B; PBL, plasmablast. H, Representative flow cytometry plots and gating strategy of splenic MB, GCB, and DZ/LZ B cells from a 10-week-old healthy C mouse (top) and lymphoma cells from a PPMBC lesion (middle). Bottom, an overlay of both samples. A total of 10 PPMBC lymphomas was analyzed; additional samples are illustrated in Supplementary Fig. S8, full gating strategy is depicted in Supplementary Fig. S12A. H–I, *, P ≤ 0.05, Welch unpaired two-tailed t test.