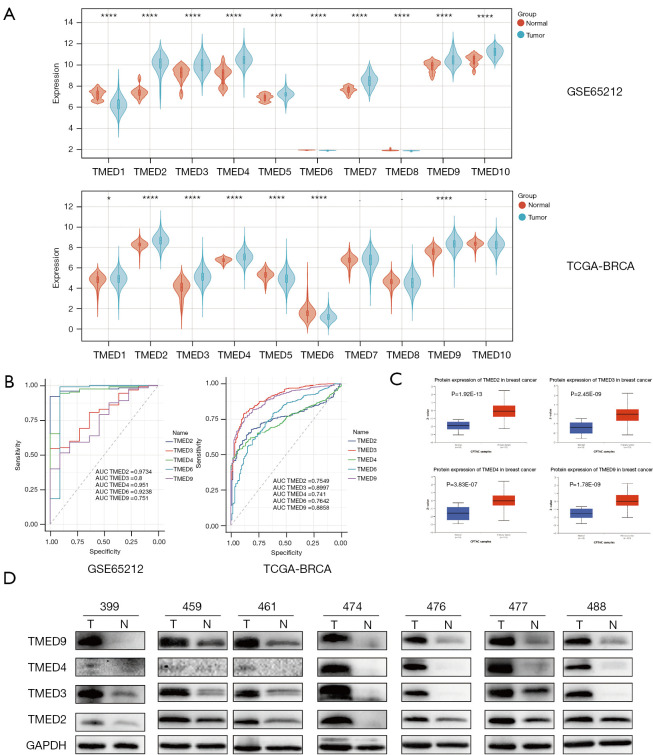
Figure 2.
The expressions and diagnostic value of TMED2/3/4/9 in breast cancer tissues (A) Comparison of the expressions of TMED family in breast cancer tissue and normal tissue by analyzing the GEO microarray dataset GSE65212 as well as the RNA sequencing data from TCGA-BRCA cohort. TMED2/3/4/9 was upregulated, while TMED6 was downregulated in cancer tissues. Filter criteria: P value <0.05. (B) ROC curve analysis of candidate genes of TMED family based on their expressions in GSE65212 and TCGA-BRCA datasets. GSE65212 dataset: TMED2: AUC (95% CI), 0.9734 (0.9483, 0.9986); TMED3: AUC (95% CI), 0.8 (0.6872, 0.9128); TMED4: AUC (95% CI), 0.951 (0.889, 1); TMED6: AUC (95% CI), 0.9238 (0.7787, 1); TMED9: AUC (95% CI), 0.751 (0.6177, 0.8844); TCGA-BRCA dataset: TMED2: AUC (95% CI), 0.7549 (0.7227, 0.7871); TMED3: AUC (95% CI), 0.8997 (0.873, 0.9264); TMED4 AUC (95% CI), 0.741 (0.7088, 0.7732); TMED6 AUC (95% CI), 0.7642 (0.7199, 0.8086); TMED9 AUC (95% CI), 0.8858 (0.8602, 0.9114). (C) Analysis of TMED2/3/4/9 protein level, based on proteomic CPTAC data from UALCAN database. (D) TMED2/3/4/9 protein levels in paired cancerous and non-cancerous mammary samples identified by western blot assay. *, P<0.05; ***, P<0.001; ****, P<0.0001. TMED, transmembrane p24 trafficking protein; TCGA, Then Cancer Genome Atlas; BRAC, breast carcinoma; GEO, Gene Expression Omnibus; ROC, receiver operating characteristic; AUC, area under the curve; CPTAC, Clinical Proteomic Tumor Analysis Consortium; UALCAN, University of Alabama at Birmingham CANcer data analysis portal.

