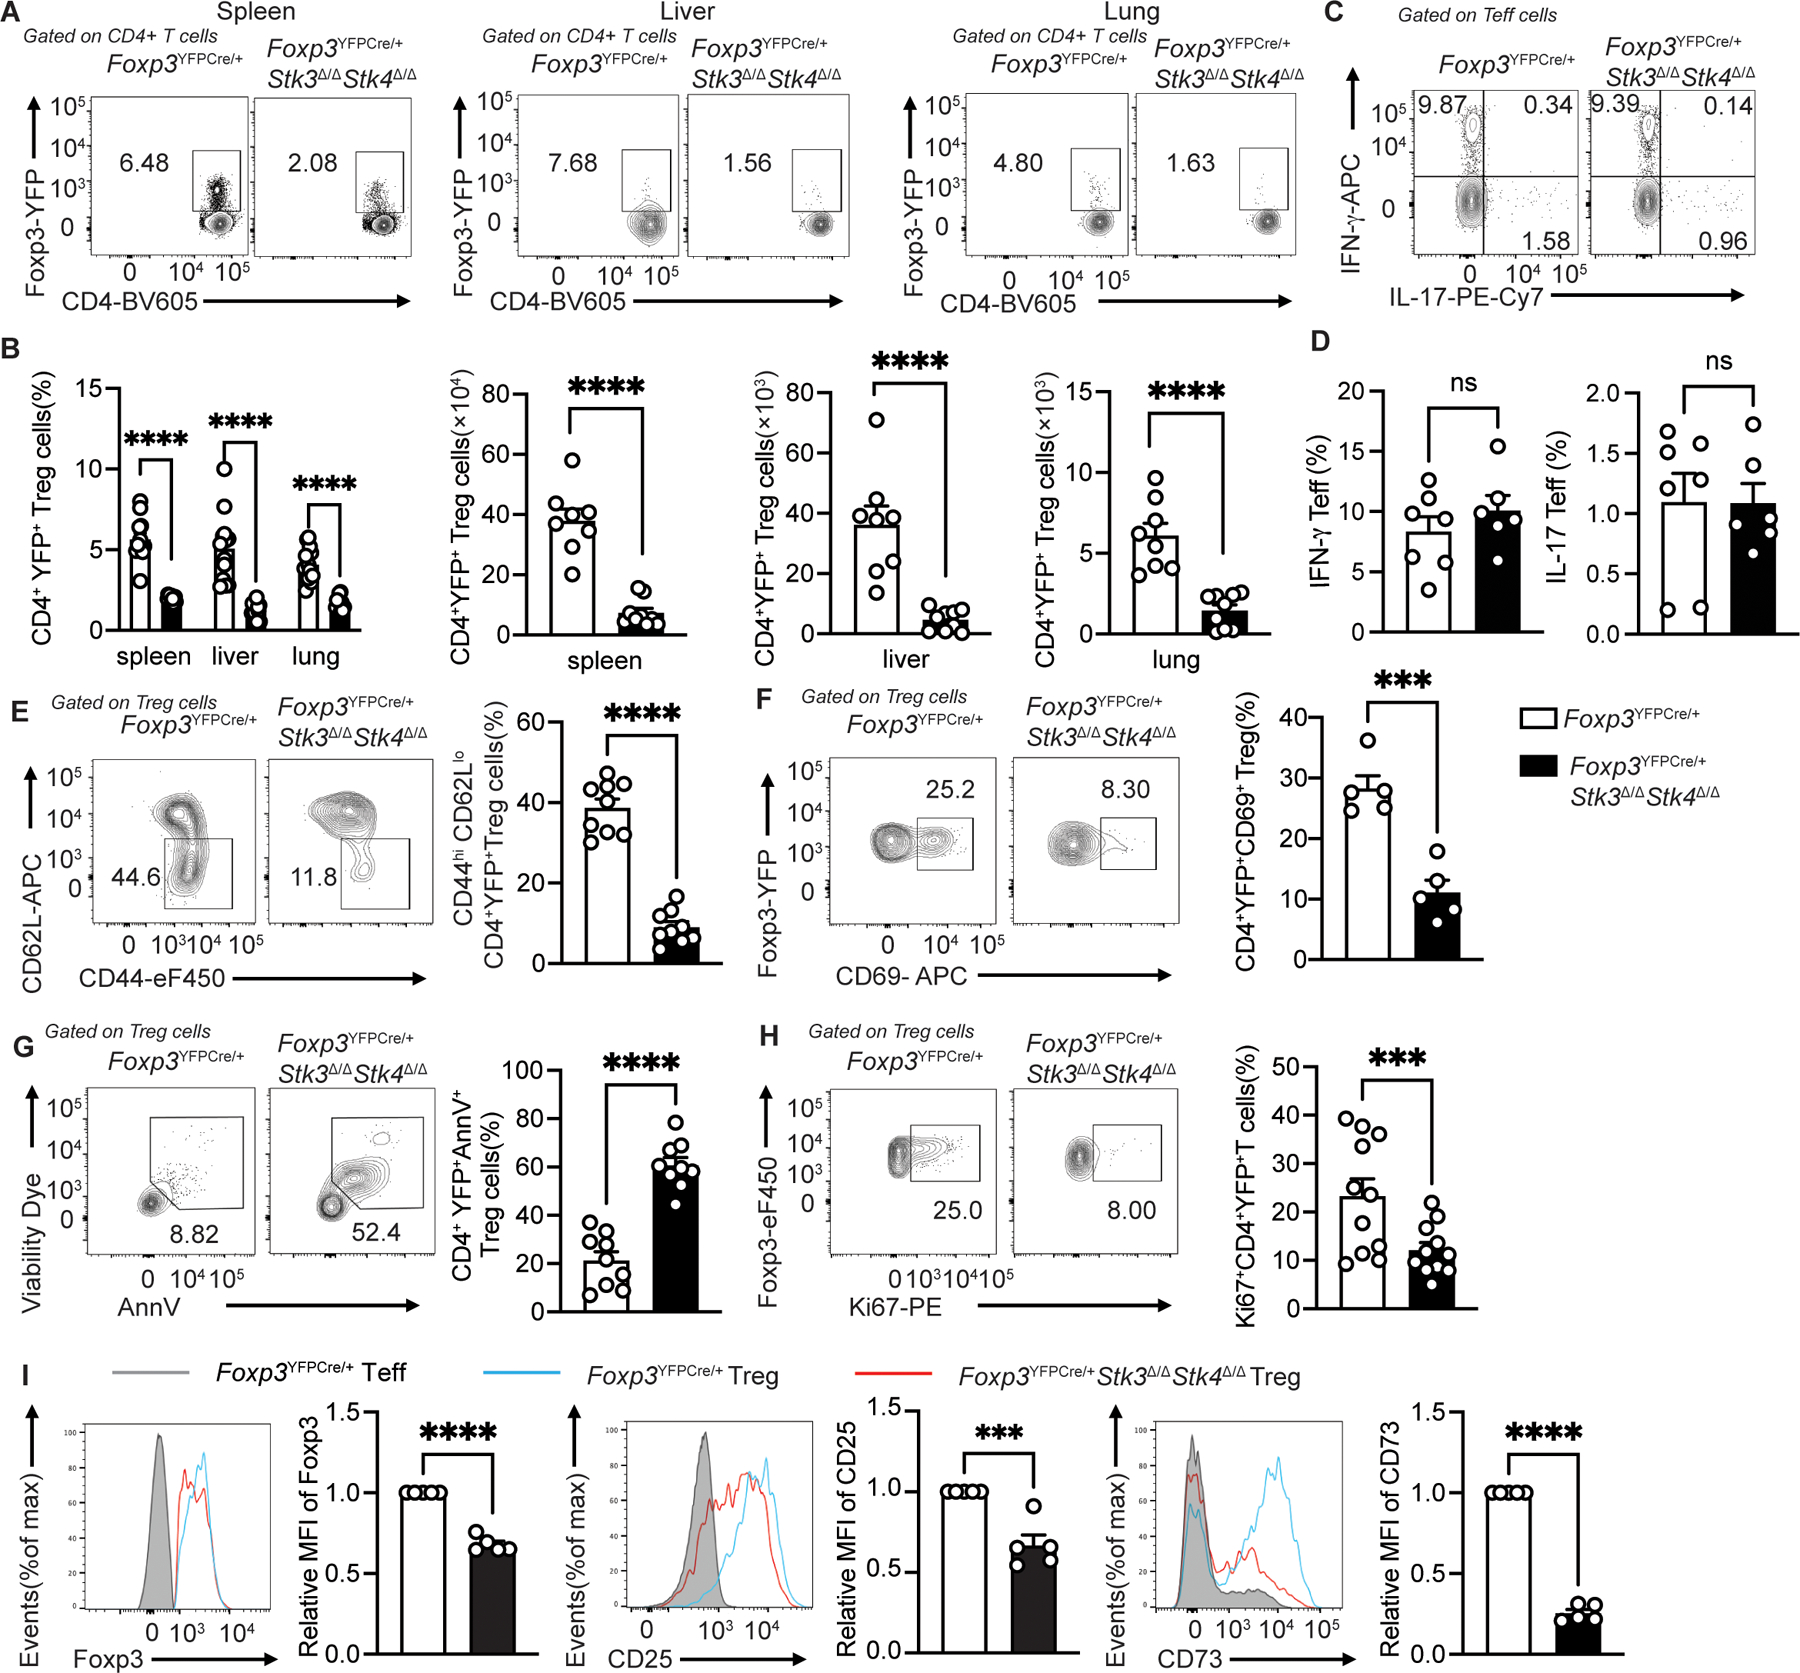
Figure 1. STK3/4 deficiency leads to activation defects of Treg cells.

(A) Flow cytometric analysis of CD4+ Foxp3+Treg cells from spleen, liver and lung of Foxp3YFPCre/+ and Foxp3YFPCre/+Stk3∆/∆Stk4∆/∆ mice and (B) quantification of frequencies (n=10–13 for each group) and numbers (n=8 for Foxp3YFPCre/+ group; n=9 for Foxp3YFPCre/+Stk3∆/∆Stk4∆/∆ group) (scatter plots with means ± S.E.M.) of each contour plot in (A). (C and D) Representative flow cytometric analysis (C) and frequencies (D, scatter plots with means ± S.E.M.) of IFNγ+ and IL-17+ CD4+Foxp3−Teff cells (n=6–7 per group). The results represent one of three independent experiments. (E) Representative flow cytometric analysis and frequencies (scatter plots with means ± S.E.M.) of CD62LloCD44hi CD4+YFP+Treg cells (n=9 per group). The results represent pool of three independent experiments. (F) Representative flow cytometric analysis and frequencies (scatter plots with means ± S.E.M.) of CD4+YFP+CD69+ Treg cells (n=5 per group). (G and H) AnnexinV+ Viability dye+ splenic Treg cells (G) (n=9 for each group) and Ki67+ Treg cells (G) (n=11 for each group). (I) Flow cytometric analysis and scatter plot representation of relative Foxp3 mean fluorescence intensity (MFI), relative CD25 MFI and relative CD73 MFI of CD4+YFP+ Treg cells from spleen of Foxp3YFPCre/+ and Foxp3YFPCre/+Stk3∆/∆Stk4∆/∆ mice (n=5 per group). Each point represents one mouse. Error bars indicate the standard error of the means (s.e.m). The results are representative of three independent experiments. Statistical tests: ***, P<0.005, ****, P<0.0001 by two-way ANOVA with Sidak’s multiple comparisons test (B) or Student’s unpaired two tailed t test (B to I).
