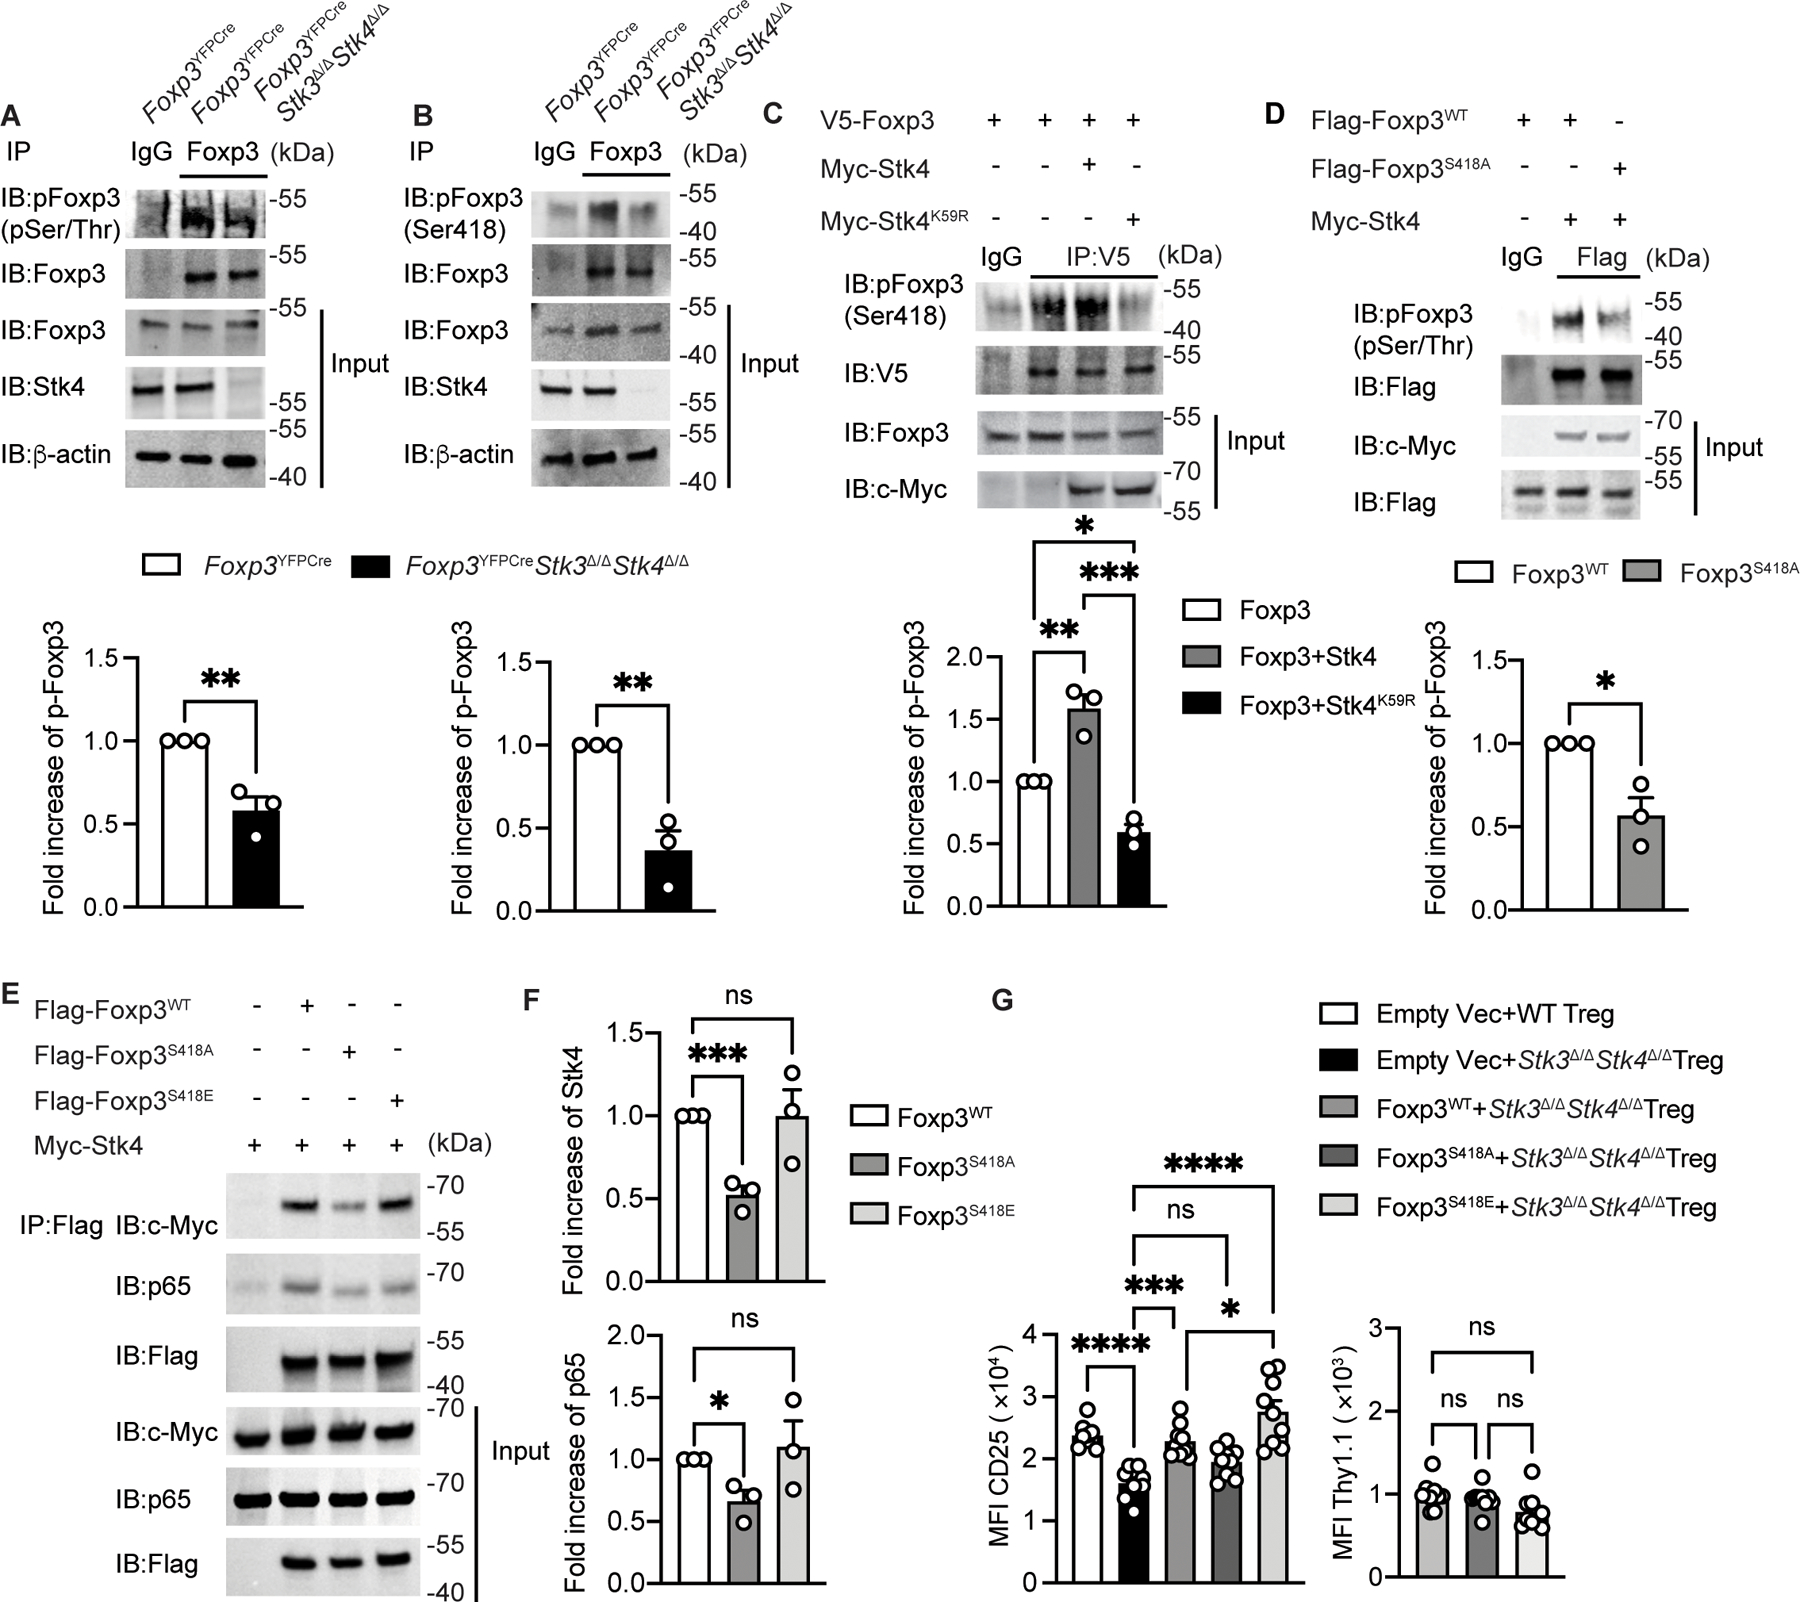
Figure 4. Foxp3 S418 phosphorylation is Stk4-dependent and stabilizes the Stk4-Foxp3-p65 complex.

(A,B) Immunoblot analysis (upper panel) and densitometry (lower panel) of phospho-serine/threonine Foxp3 (A) and Foxp3 phospho-S418 Foxp3 (B) in Foxp3YFPCre and Foxp3YFPCreStk3∆/∆Stk4∆/∆ Treg cells stimulated with anti-CD3/ CD28 beads. Cell lysates were immunoprecipitated with anti-Foxp3 antibody and then immunoblotted with the indicated antibody. (C,D) Immunoblot analysis (upper panel) and densitometry (lower panel) of phospho-S418 Foxp3 in Jurkat cells transfected with the indicated plasmids then stimulated with CD3/CD28 beads. Cell lysates were immunoprecipitated with an anti-V5 mAb (C) or with anti-Flag mAb (D) and then immunoblotted with the indicated antibodies. (E,F) immunoblot analysis (E) and densitometry (F) of p65 and Foxp3 association in HEK293T cells transfected with the indicated plasmids. Cell lysates were immunoprecipitated with anti-Flag mAb, then immunoblotted with the indicated antibodies. (G) Scatter plot representation of CD25 and Thy1.1 MFI in Foxp3YFPCre or in transfected Foxp3YFPCreStk3∆/∆Stk4∆/∆ Treg with the indicated retrovirus (n=9 for each group). The results represent a pool of three independent experiments. Each point represents one blot for immunoblot analysis and one mouse. Error bars indicate S.E.M. Statistical tests: Student’s unpaired two tailed t test (A,B,D), one-way ANOVA with post-test analysis (C,F,G), ns: Not significant. *, P<0.05, **, P<0.01, ***, P<0.005, ****, P<0.0001.
