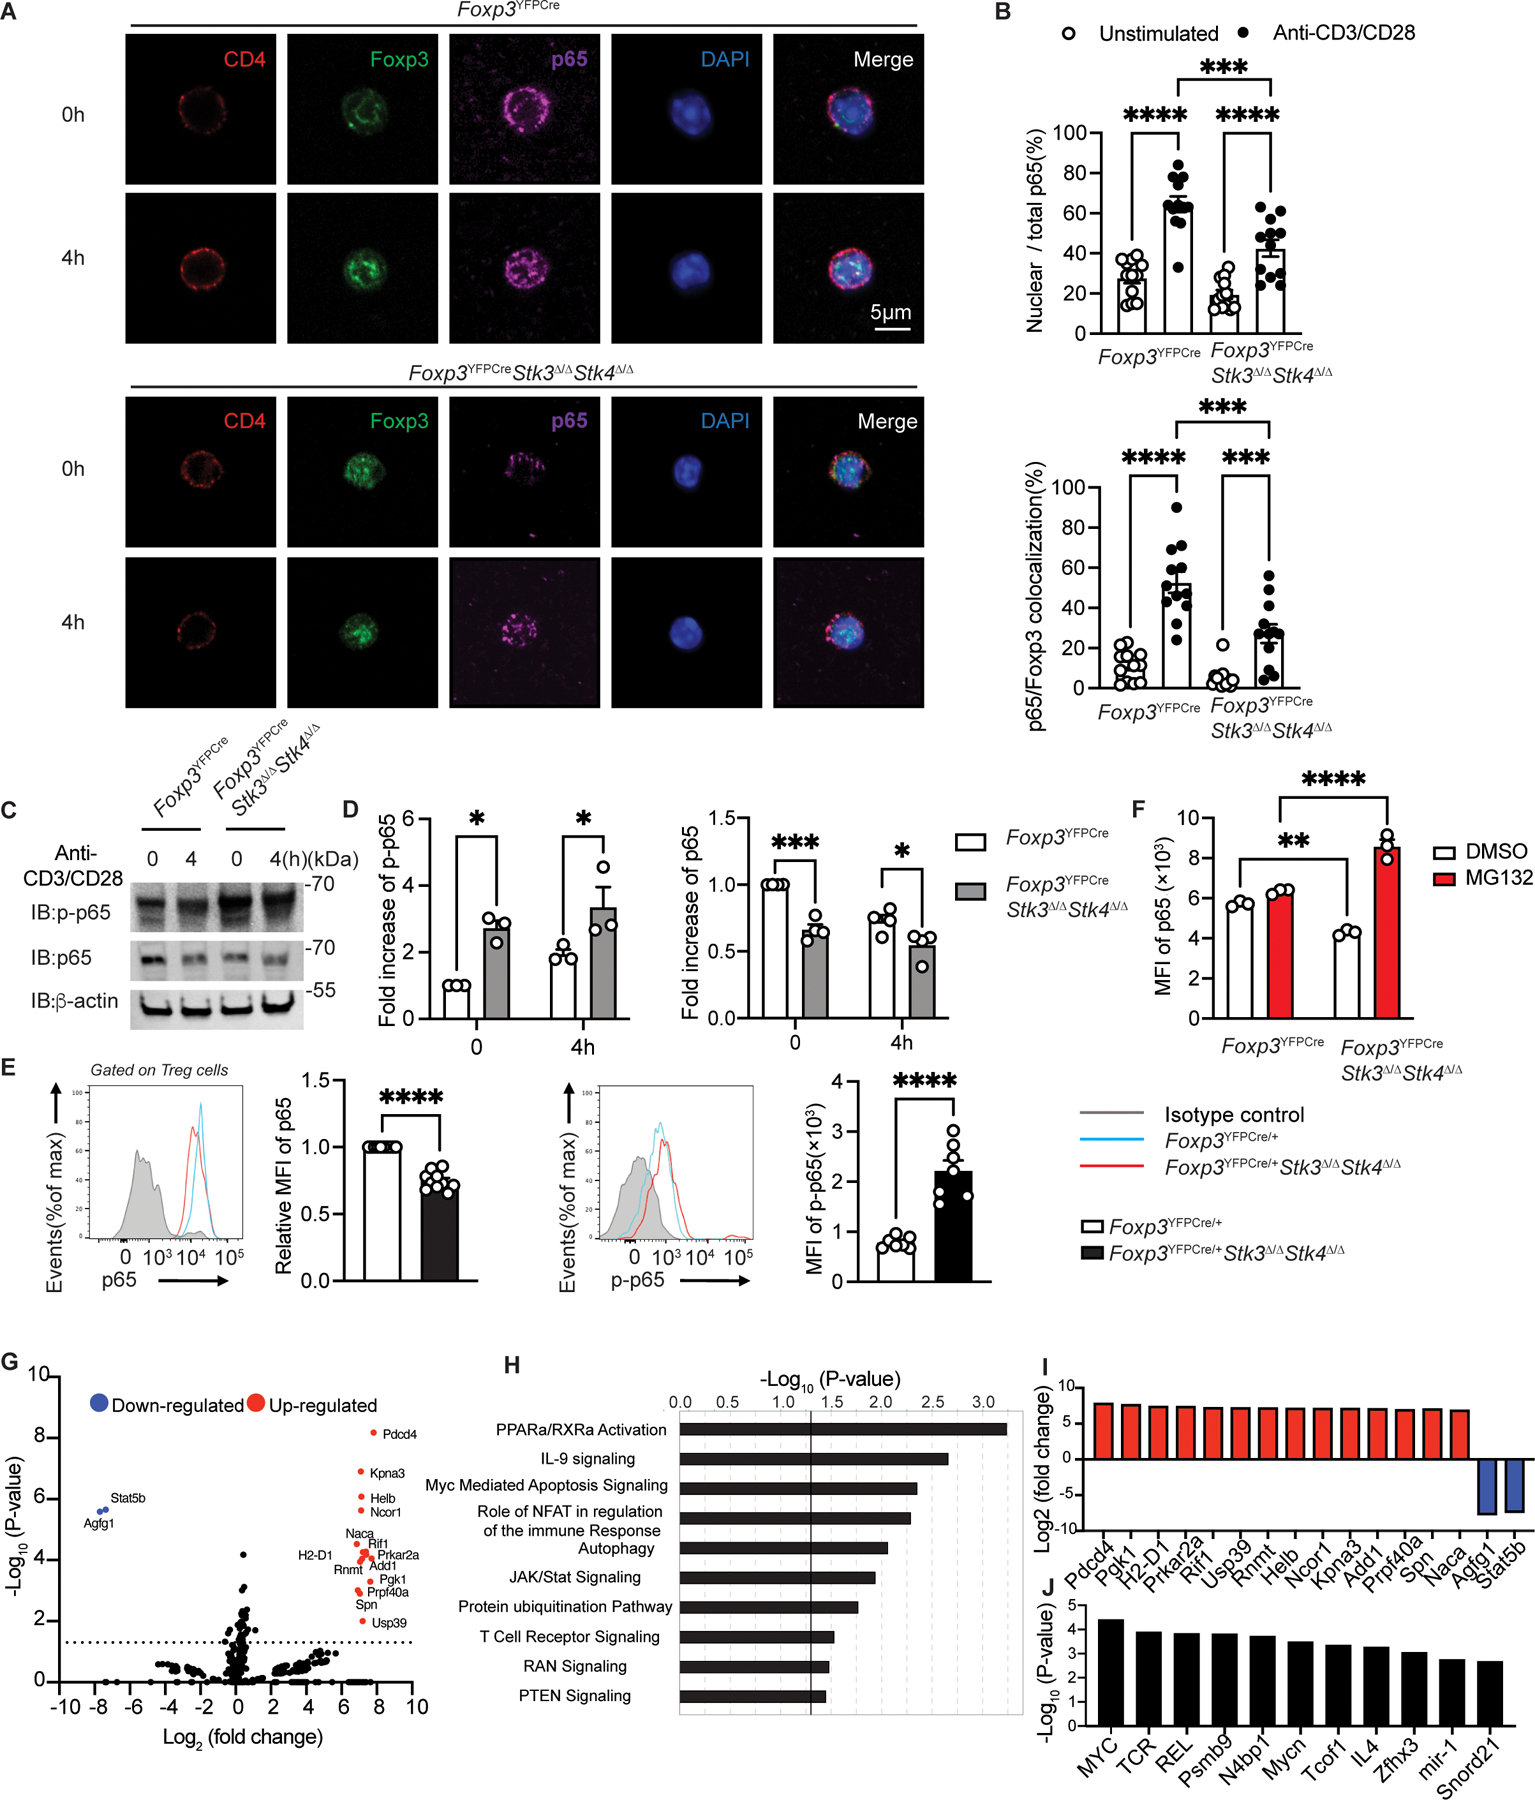
Figure 5. Impaired p65 nuclear translocation and enhanced degradation in Stk3/4 deficient Treg cells.

(A) Confocal microscopic analysis of CD4, Foxp3, p65, DAPI and Merge (B) ratios of nuclear/total Stk4 and p65/Foxp3 colocalization in Foxp3YFPCre Treg cells either unstimulated or stimulated with anti-CD3+anti-CD28 mAbs at the indicated time points (n=12 per group). (C to D) Immunoblot analysis (C) and densitometry (D) of p-p65, p65 and β-actin in Foxp3YFPCre and Foxp3YFPcreStk3∆/∆Stk4∆/∆ Treg cells. (E) Representative flow cytometric analysis and scatter plot representation of p65 (n=10 per group) and p-p65 (n=7 per group) MFI in Treg cells from Foxp3YFPCre/+ or Foxp3YFPCre/+Stk3∆/∆Stk4∆/∆. (F) Scatter plot representation of p65 MFI in Foxp3YFPCre or in Foxp3YFPCreStk3∆/∆Stk4∆/∆ Treg cells either untreated or treated with MG132. (G) Volcano plot of phosphorylated proteins identified by phosphoproteomics in Foxp3YFPCreStk3∆/∆Stk4∆/∆ versus Foxp3YFPCre Treg cells. (H) Pathway analysis of phosphorylated protein in Foxp3YFPCreStk3∆/∆Stk4∆/∆ versus Foxp3YFPCre Treg cells. (I) Increased or decreased phosphorylated proteins identified in Foxp3YFPCreStk3∆/∆Stk4∆/∆ versus Foxp3YFPCre Treg. (J) Predicted upstream regulators deduced from phosphoproteomic analysis of Stk3/4 deficient versus WT Treg cells. Each point represents one cell in the confocal analysis, one blot for immunoblot analysis and one mouse for the flow analysis. Error bars indicate S.E.M. Statistical tests: Student’s unpaired two tailed t test (E), two-way ANOVA with post-test analysis (B,D,F), ns: Not significant. P<0.05, **, P<0.01, ***, P<0.005, ****, P<0.0001.
