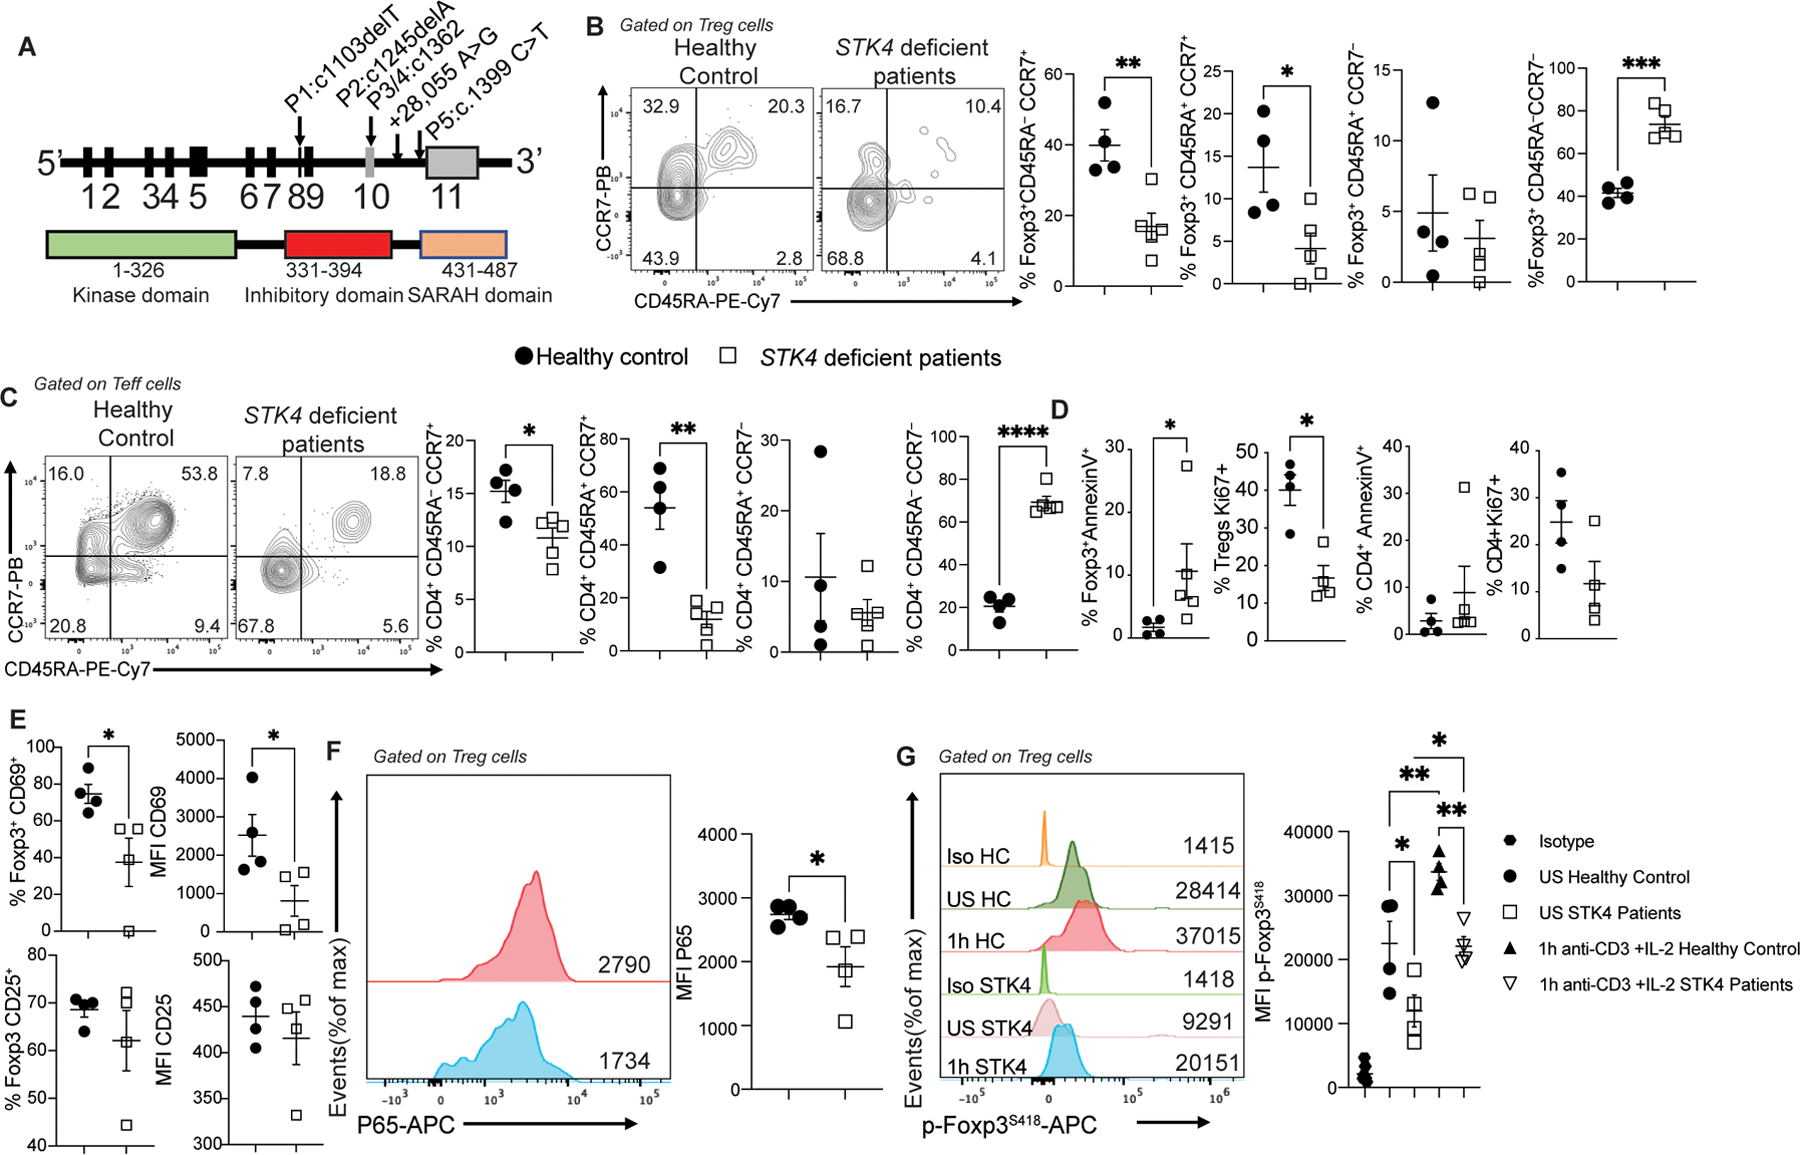
Fig. 7. Immune regulatory abnormalities in STK4-deficient patients.

(A) Schematic representation of STK4 illustrating its encoding exons, the protein domains, and mapped mutations of four patients. The kinase domain, the inhibitory domain and the SARAH (Sav/Rassf/Hpo) domain are indicated. (B and C) Flow cytometric analysis and cell frequencies of CD45RA and CCR7 expression on circulating Treg cells (B) and Teff cells (C) of control subjects (n=4) and STK4 deficient patients (n=5). (D) Cell frequencies of AnnexinV and Ki67 expression on circulating Treg and Teff cells of control subjects (n=4) and STK4 deficient patients (n=5 for AnnexinV and n=4 for Ki67). (E) Cell frequencies and MFI of CD69 and CD25 expression on circulating Treg cells of control and STK4 deficient patients (n=4/group). (F) Flow cytometric analysis and MFI of P65 expression on circulating Treg cells of control and STK4 deficient patients (n=4/group). (G) Representative histograms of MFI of phospho-S418 Foxp3 in circulating Treg cells of healthy control (HC) and STK4 deficient patients that were either unstimulated (US) or stimulated with anti-CD3 +IL-2 (n=4/group). Each dot represents one patient. Error bars indicate S.E.M. Statistical tests: Student’s two tailed t test (B to F) or one-way ANOVA with post-test analysis (G). *p<0.05, **,P<0.01, ***,P<0.001, ****,P<0.0001.
